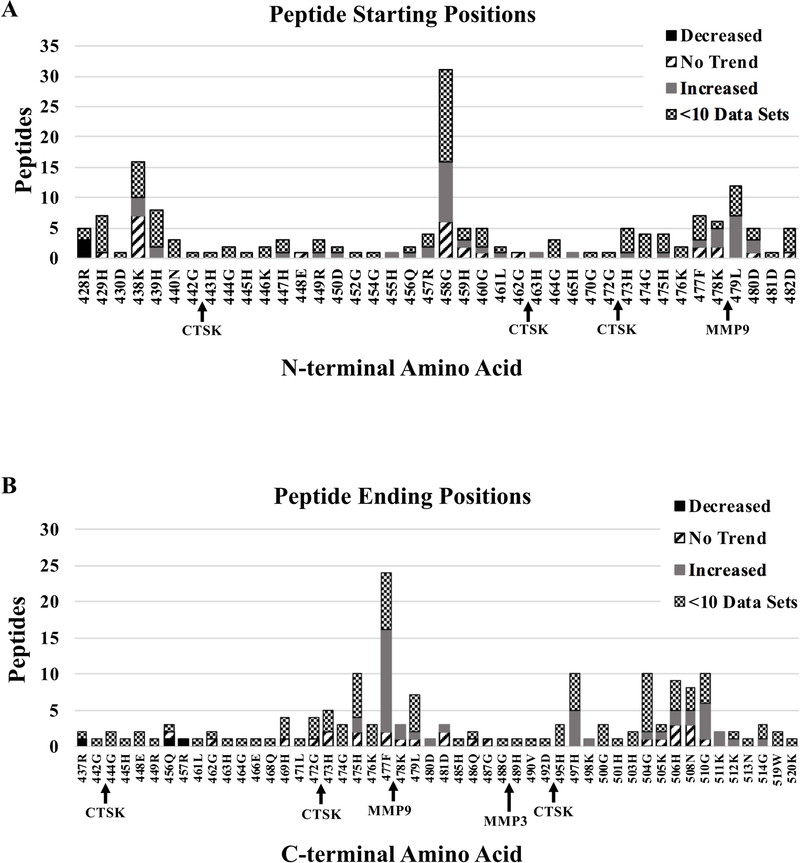
Figure 2.
Analysis of D5 Proteolysis. A. Bar graph showing the number of peptides sharing the same N-terminal amino acids. B. Bar graph showing the number of peptides sharing the same C-terminal amino acid. A–B. Bars are subdivided and color coded according to legend. “Decreased” indicates peptides that significantly decreased during the course of normal pregnancy. “Increased” indicates peptides that significantly increased during normal pregnancy while “no trend” indicates peptides that displayed no significant trend. “<10 Data sets” indicates peptides that presented less than 10 complete datasets and were therefore not statistically analyzed. Arrows underneath the bar graphs indicate protease cleavage sites predicted by PROSPER. Arrows in A indicate the protease is predicted to generate the start site immediately to the right of the arrow. Arrows in B indicates the protease is predicted to generate the end site immediately to the left of the arrow. CTSK = Cathepsin K, MMP9 = Matrix Metalloprotease 9, MMP3 = Matrix Metalloprotease 3.

