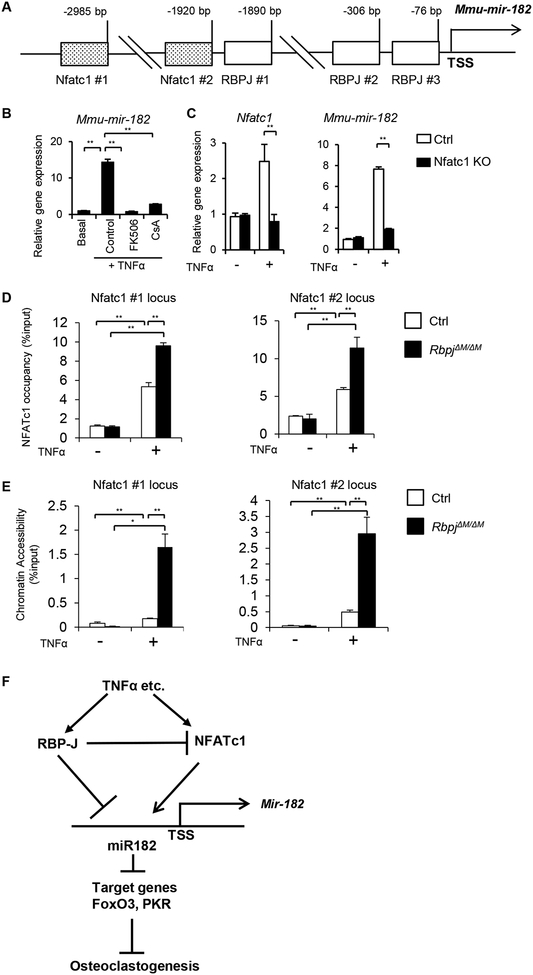
Figure 6. NFATc1 directly targets miR182 and activates its expression.
A. A diagram depicting two putative NFATc1 binding sites and three RBPJ binding motifs in the mouse miR-182 promoter region. B. qPCR analysis of mature mouse miR-182 (mmu-mir-182) expression using BMMs from the WT mice treated with FK506 (10 ug/ml), CsA (10 ug/ml) or the control DMSO vehicle for two days in the presence or absence of TNFα. C. qPCR analysis of mature mouse miR182 (mmu-mir-182) expression using BMMs from the control and Nfatc1 KO mice treated with or without TNFα for two days. D. ChIP analysis of NFATc1 occupancy at the indicated loci in the miR182 promoter in the Ctrl or RbpjΔM/ΔM BMMs stimulated or not with TNFα (40 ng/ml) for 48 h. E. FAIRE analysis of chromatin accessibility at the NFATc1 binding sites in the miR-182 promoter in the Ctrl or RbpjΔM/ΔM BMMs stimulated or not with TNFα (40 ng/ml) for 48 h. F. A model showing a regulatory network, in which RBPJ suppresses the expression of NFATc1 and miR182, miR182 as a direct target receives negative regulatory signals from RBP-J but positive signals from NFATc1, and miR182 further regulates osteoclastogenesis via its targets, PKR and FoxO3. Data are mean ± SEM. **p < 0.01.

