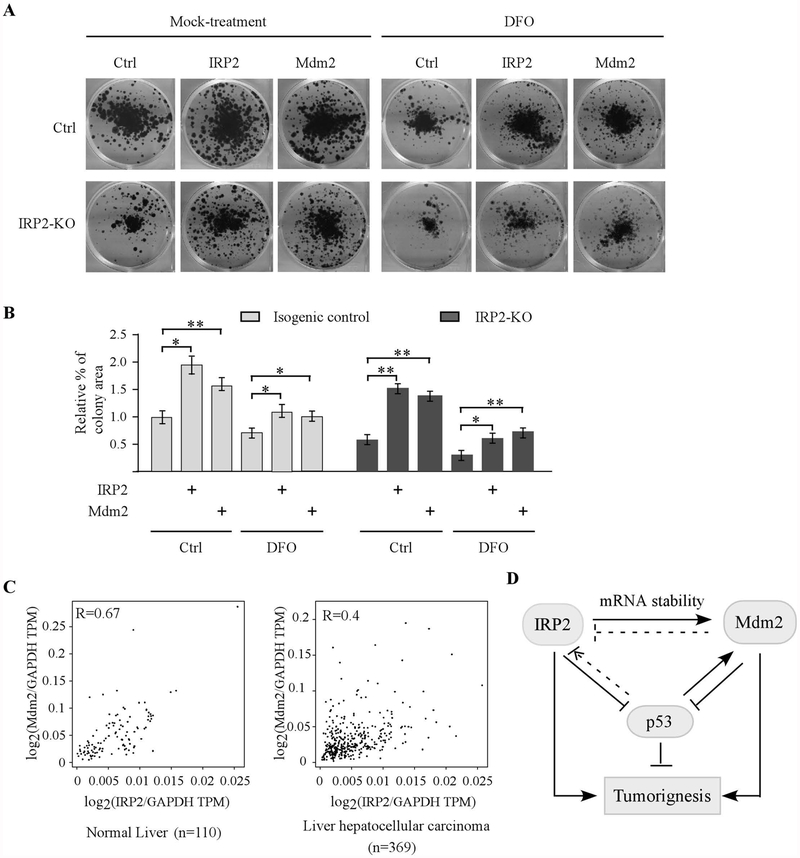
Figure 6.
The IRP2-Mdm2 axis plays a role in cell proliferation. (A) Isogenic control and IRP2-KO p53−/− HCT116 cells were transiently transfected with a control vector or a vector expressing IRP2 or Mdm2 for 24 hours, followed by colony formation with or without treatment of DFO (100 μM, 24 hours). (B) Quantification of colony formation assays in (A). * indicates p < 0.05 and ** indicates p< 0.01 by paired Student’s t test. (C) Mdm2 expression is associated with IRP2 expression in normal liver tissues (left panel) and liver hepatocellular carcinomas (right panel). The analysis was performed using the GEPIA2 database (http://gepia2.cancer-pku.cn/#correlation). Statistical analysis suggests a strong correlation between IRP2 and Mdm2 expression in normal liver tissues (Pearson’s r=0.67) and cancerous liver tissues (Pearson’s r=0.4). (D) A model proposed to elucidate the interplay among IRP2, Mdm2, and p53.

