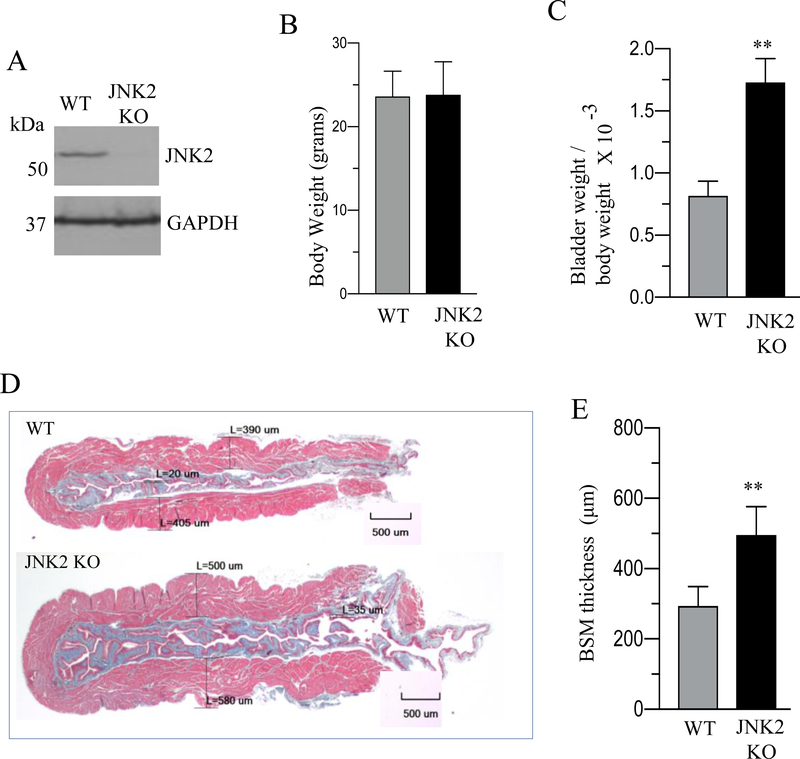
Figure 9. Increased bladder muscle mass in JNK2 KO mice.
A: Total proteins of BSM strips from WT and JNK2 KO mice were subjected to immunoblot analysis and the expression level of JNK2 was determined. Representative immunoblot showing the expression level of JNK2 in JNK2 KO mice compared with WT mice. GAPDH was used as a loading control. B-C: Body weights, and bladder weight to body weight ratio of WT and JNK2 KO mice are shown. D: Masson trichrome staining of bladder cross sections of WT and JNK2 KO mice is shown. The red staining in each image is smooth muscle bundles. The blue staining in each image is collagen fibers. Scale bars = 500 μm E: Quantification of trichrome image. Data are expressed as means ± SD (B, C and E), n = 10 mice in each group (B and C); n = 4 mice in each group (A & E). **, P < 0.01 versus WT mice.

