Figure 3.

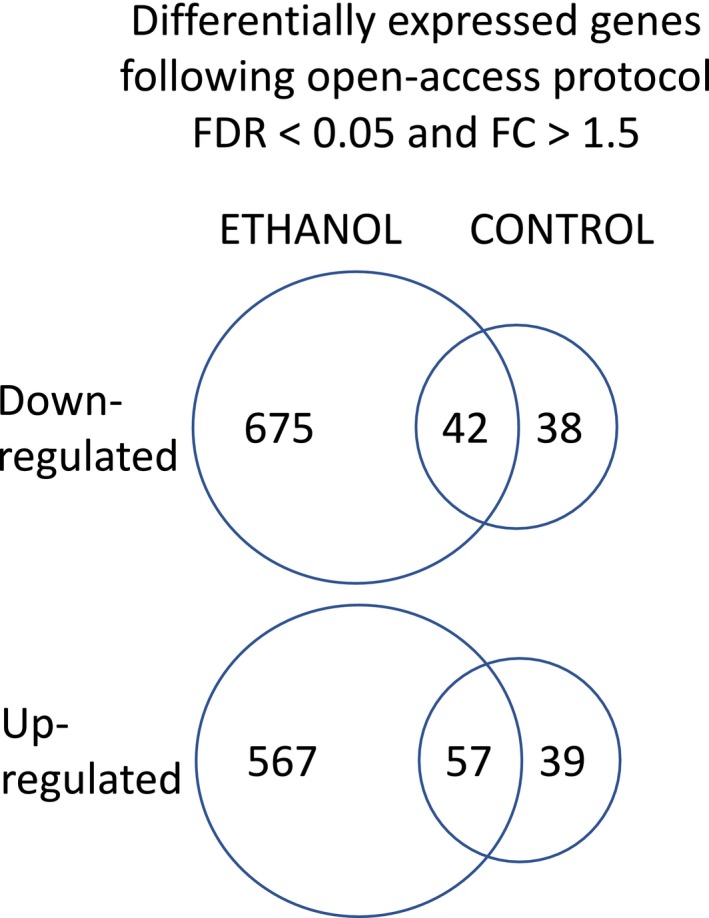
Venn diagram indicating differentially expressed genes (DEGs) following open‐access protocol that reached criteria (q < 0.05 and fold change (FC) >1.5) and whether they were identified in EtOH subjects, controls, or both.

Venn diagram indicating differentially expressed genes (DEGs) following open‐access protocol that reached criteria (q < 0.05 and fold change (FC) >1.5) and whether they were identified in EtOH subjects, controls, or both.