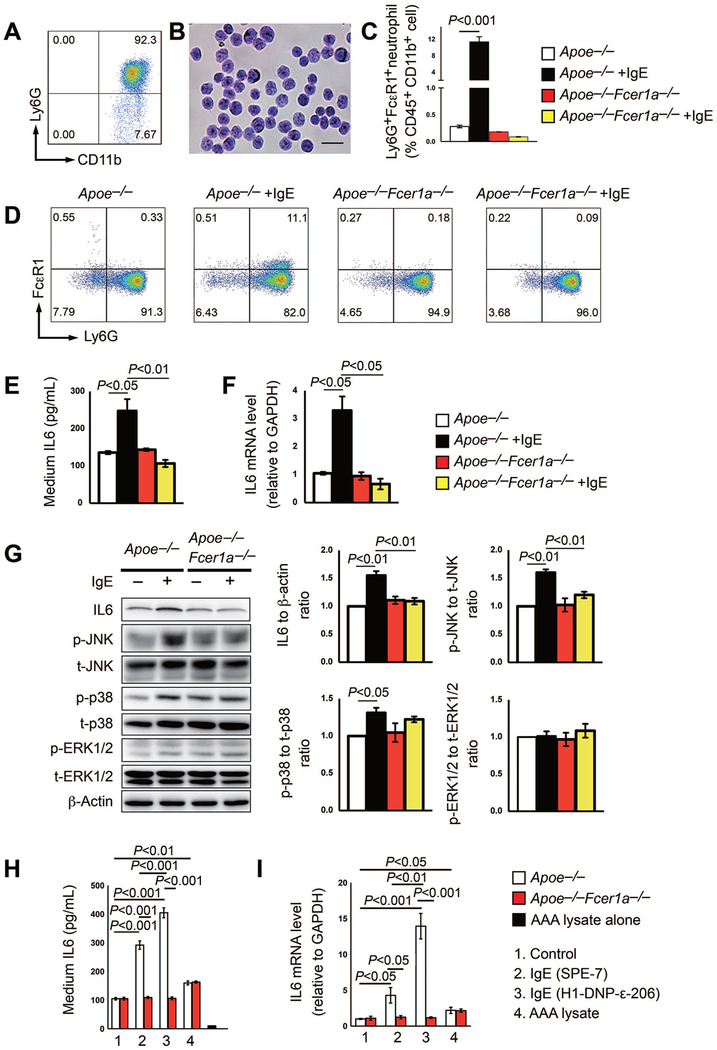
Figure 6.
IgE activity in inducing neutrophil IL6 expression and MAPK activation. A/B. The purity of neutrophils isolated from Apoe−/− and Apoe−/−Fcer1a−/− mice bone marrow was verified by FACS and Giemsa staining. Scale: 50 μm. C/D. FACS analysis to detect FcεR1 expression on Ly6G+ neutrophils treated with and without 25 μg/ml of IgE for 6 hrs. Representative images are show in panel D. E/F. Neutrophil culture media supernatant IL6 levels and IL6 mRNA levels in neutrophils from Apoe−/− and Apoe−/−Fcer1a−/− mice treated with and without IgE as in C/D. G. Representative Western blot images and quantification of IL6, phosphor (p)-JNK, total (t)-JNK, p-p38, t-p38, p-ERK1/2, and t-ERK1/2 in cultured neutrophils from Apoe−/− and Apoe−/−Fcer1a−/− mice treated with or without 25 μg/ml IgE for 6 hrs. H/I. Neutrophil culture media supernatant IL6 levels and IL6 mRNA levels in neutrophils from Apoe−/− and Apoe−/−Fcer1a−/− mice treated with and without 25 μg/ml aggregated and cytokinergic IgE SPE-7, monomeric and poorly cytokinergic IgE H1-DNP-ε−206, and AAA lysate. AAA lysate alone without neutrophils was used as ELISA negative control. Data are mean±SEM from three independent experiments.

