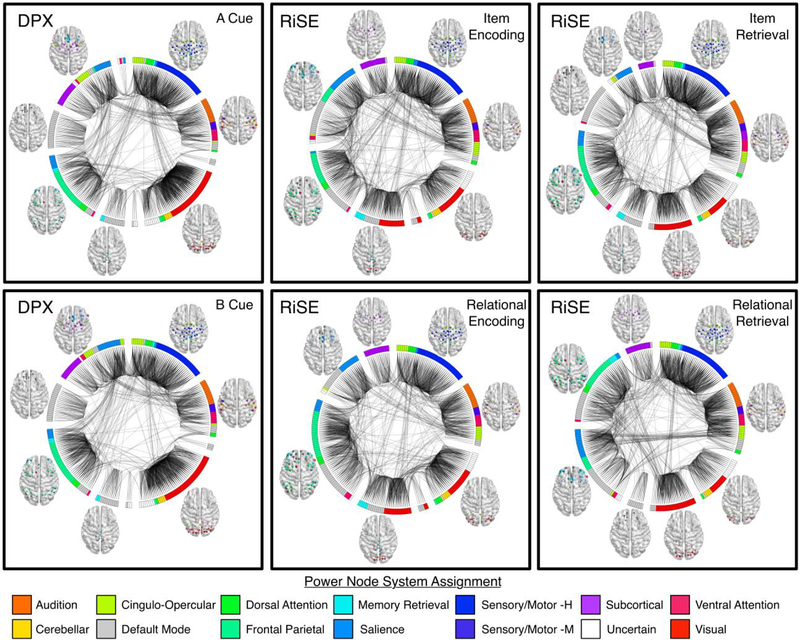
Figure 6:
Brain graphs of healthy adults performing the DPX (left column), RiSE encoding (middle column), and RiSE recognition (right column) tasks. Low cognitive control conditions for each task are shown on the top row, high cognitive control conditions are shown on the bottom row. Edges displayed in each graph represent the strongest 5% of functional connections, groups of nodes indicate their module assignment defined using the Louvain Modularity algorithm in the BCT. The color of each node corresponds to one of the 14 cognitive systems proposed in Power et al., (2011). Graphs were visualized using BrainNet Viewer and Circos.

