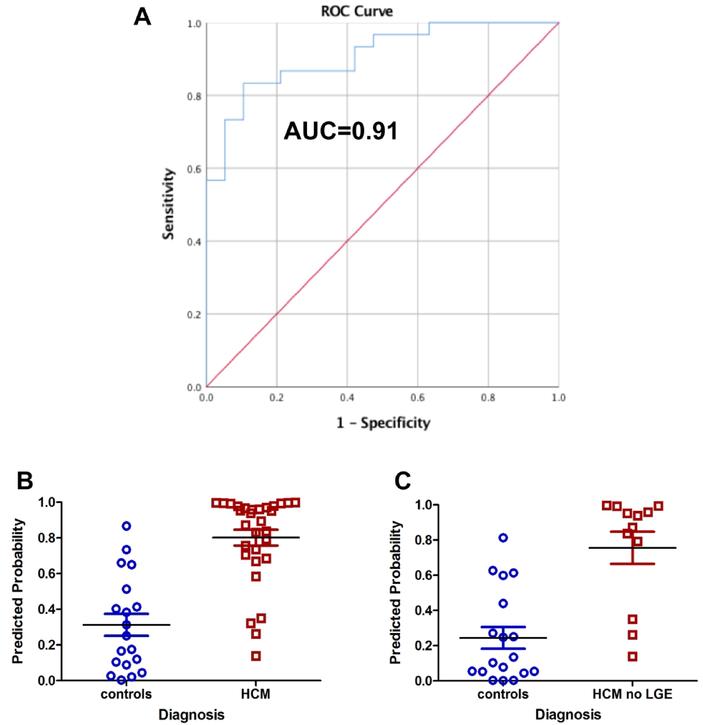
Figure 2:
A) Receiver operating characteristic curve for model using left ventricular ejection fraction and native T1 at the mid left ventricle to predict a diagnosis of hypertrophic cardiomyopathy. B) Scatterplot of model results demonstrates some overlap in patients with and without hypertrophic cardiomyopathy. C) Scatterplot of same model only in patients without late gadolinium enhancement (milder disease) again demonstrates some overlap of patients with an without hypertrophic cardiomyopathy.

