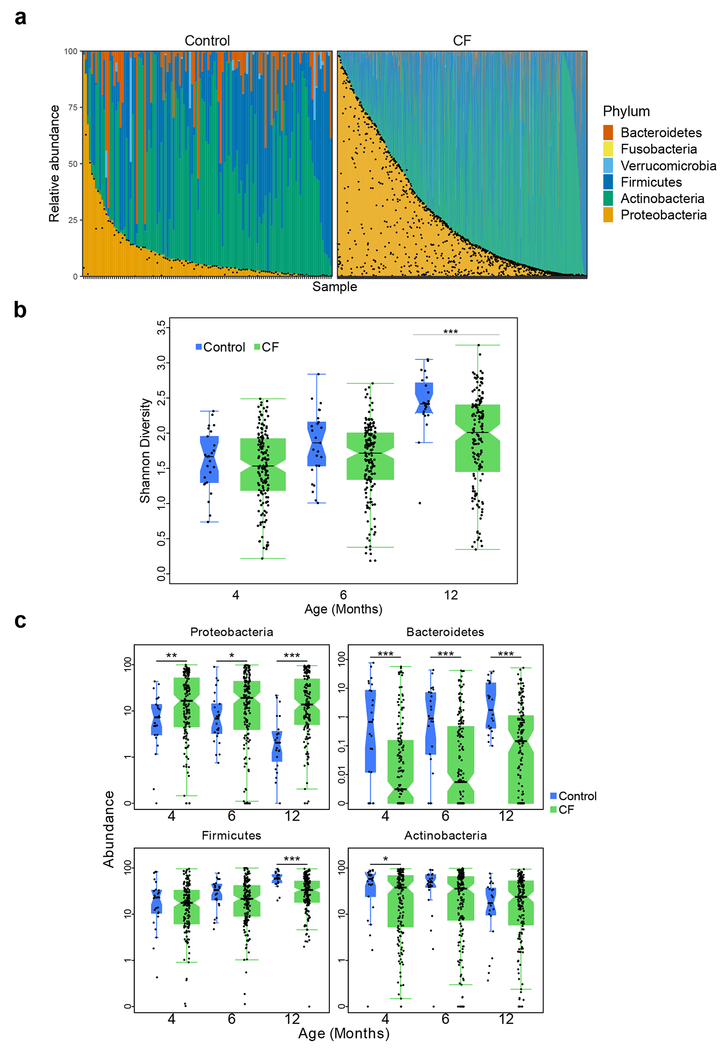
Figure 1. Fecal microbial composition is altered in infants with CF compared to controls.
a, The microbiota of all samples at the phylum level among control infants (left) and infants with CF (right). Samples are ordered within each cohort according to the relative abundance of Proteobacteria (and then Actinobacteria for samples where relative abundance of Proteobacteria was negligible). Black dots indicate the relative abundance of E. coli in each sample. b, Boxplot of Shannon Index, with individual data, indicating slower increases in fecal microbiota diversity for infants with CF compared to controls, with significant differences at month 12. Number of samples (N), one per patient at months 4, 6 and 12: 156, 169 and 152 for infants with CF and 25, 25, and 23 for controls. c, Boxplots of Proteobacteria, Bacteroidetes, Firmicutes and Actinobacteria relative abundances at months 4, 6 and 12 for infants with CF and controls. Boxplot hinges indicate the first and third quartile, and whiskers indicate 1.5 times the IQR above and below. Indentations in each box indicate approximately the 95% confidence intervals about the median. Box width is proportional to the square root of N. One-sided Wilcoxon rank-sum test, * p < 0.05, ** p < 0.01, ***p < 0.001.

