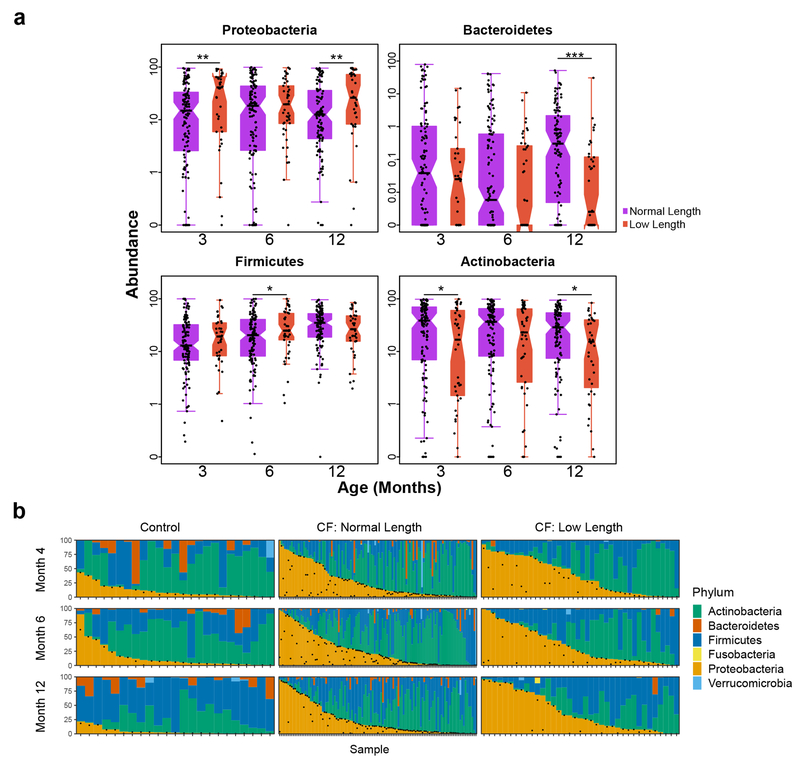
Figure 3. Low length infants with CF have more extreme dysbiosis than normal length infants with CF.
a, Boxplots of Proteobacteria, Bacteroidetes, Firmicutes and Actinobacteria relative fecal abundances at 3, 6 and 12 months for normal length compared to low length infants with CF. The number of samples (N) at month 3, 6 and 12 is 120, 124 and 113 for normal length and 38, 45, and 39 for low length infants. Hinges indicate the first and third quartile, and whiskers 1.5 times the IQR above and below. Indentations in each box indicate approximately the 95% confidence intervals about the median. Box width is proportional to the square root of N. One-sided Wilcoxon rank-sum test, * p < 0.05, ** p < 0.01, ***p < 0.001. b, Dynamics of the fecal microbiota of controls (left) and normal length (middle) and low length (right) infants with CF during the first year of life. Bars represent the relative abundances of bacterial phyla. Samples are ordered within each panel according to the relative abundance of Proteobacteria (and then Actinobacteria once the relative abundance of Proteobacteria is negligible). Vertically-aligned samples are not guaranteed to be from the same subject. Black dots indicate the relative abundance of E. coli in each sample.

