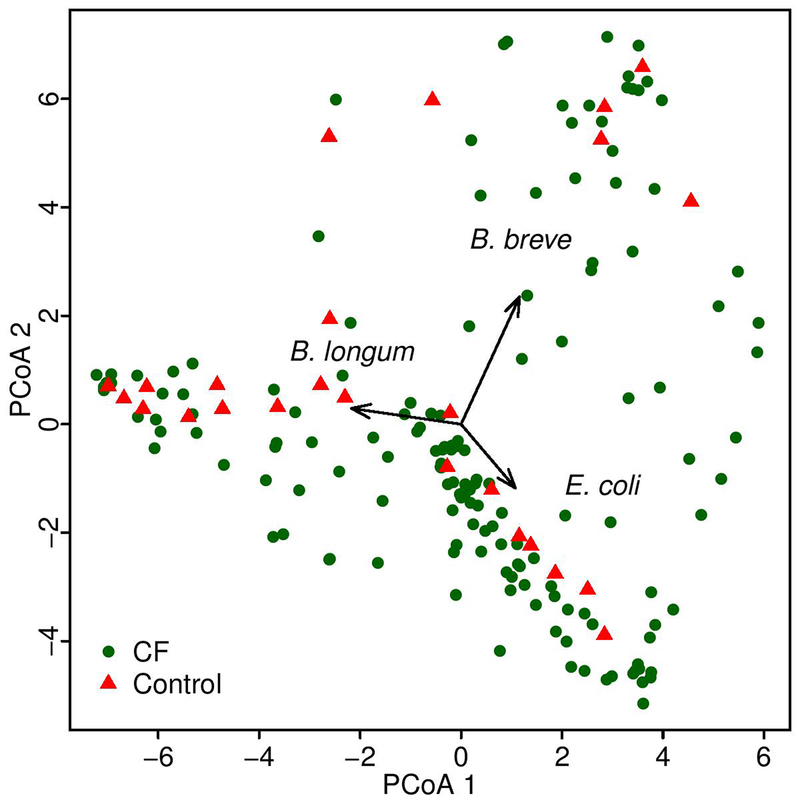
Extended Data Fig. 1. Principal coordinates analysis of the fecal microbiota of infants with CF and controls at month 4.
The structure of the fecal microbiomes of infants in this study at month 4 seen in a multidimensional scaling plot is dominated by the large abundances of Bifidobacterium longum, B. breve and E. coli. One samples is represented for each of 109 infants with CF and 25 controls. Each colored dot represents the microbiota of a different study sample, as indicated.

