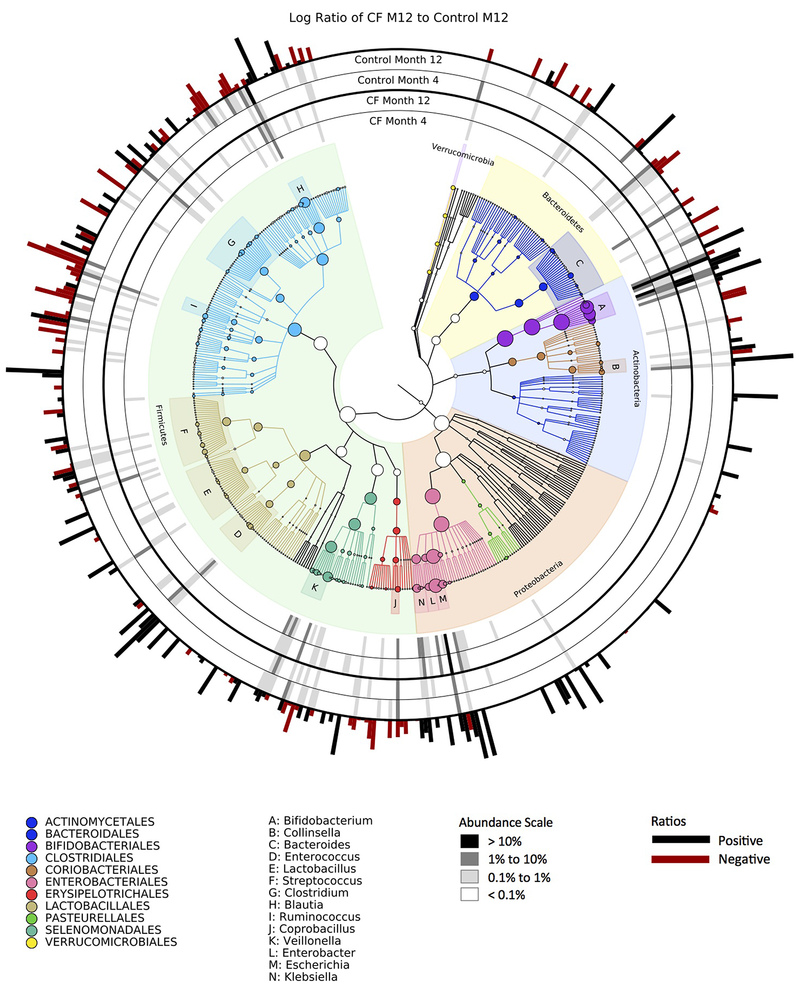
Extended Data Fig. 2. Phylogenetic plot comparing average microbiota at multiple taxonomic levels at months 4 and 12 for infants with CF and controls.
As indicated in the legend at lower right, greyscale bars indicate relative abundance; red vs. black bars on the outside of the circular graph indicate whether taxa were enriched in infants with CF (black) or controls (red) samples at month 12.

