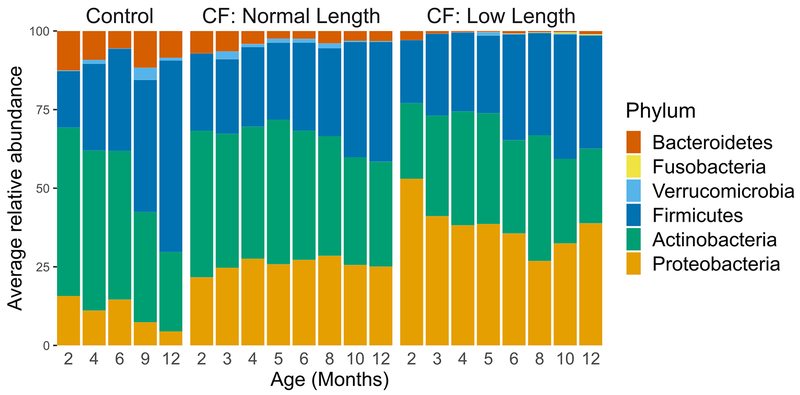
Extended Data Fig. 4. Average percent relative abundance of different bacterial phyla in fecal samples from infants with CF with normal length, infants with CF with low length and controls.
Phylum-level average microbiota at each collection time point of the control infants (left), compared to normal length infants with CF (middle), and low length infants with CF (right).

