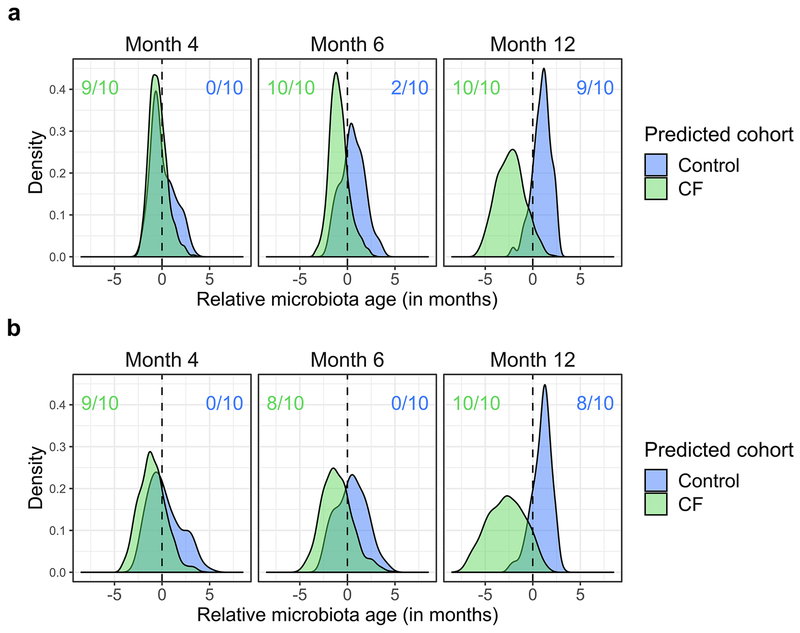
Extended Data Fig. 5. Fecal microbiota development is significantly delayed in infants with CF relative to controls when omitting infants prescribed any acid suppressors and when models are trained on a sparse set of taxonomic features.
a, infants prescribed any acid suppressors, including proton pump inhibitors and/or H2 blockers were omitted. b, models trained on a sparse set of taxonomic features. Shown are the distributions of “relative microbiota age” (x-axis), following the approach in Subramanian et al.21 for each subject group (CF or controls) using abundances at all taxonomic levels as the normalized error in a sample’s predicted microbiota age when using a computational model constructed for the other group (e.g., negative relative microbiota age indicates delayed development compared to the group used to construct the model). Y-axis, density of samples that mapped to a given relative microbiota age at the indicated timepoints. Colored ratios summarize the fraction of replicate full-feature models that produced a distribution of relative microbiota ages that was significantly negatively (green for CF samples relative to control models) or positively (blue for control samples relative to CF models) different from zero (q < 0.01, one-sided Wilcoxon signed-rank test).

