
Figure 3.
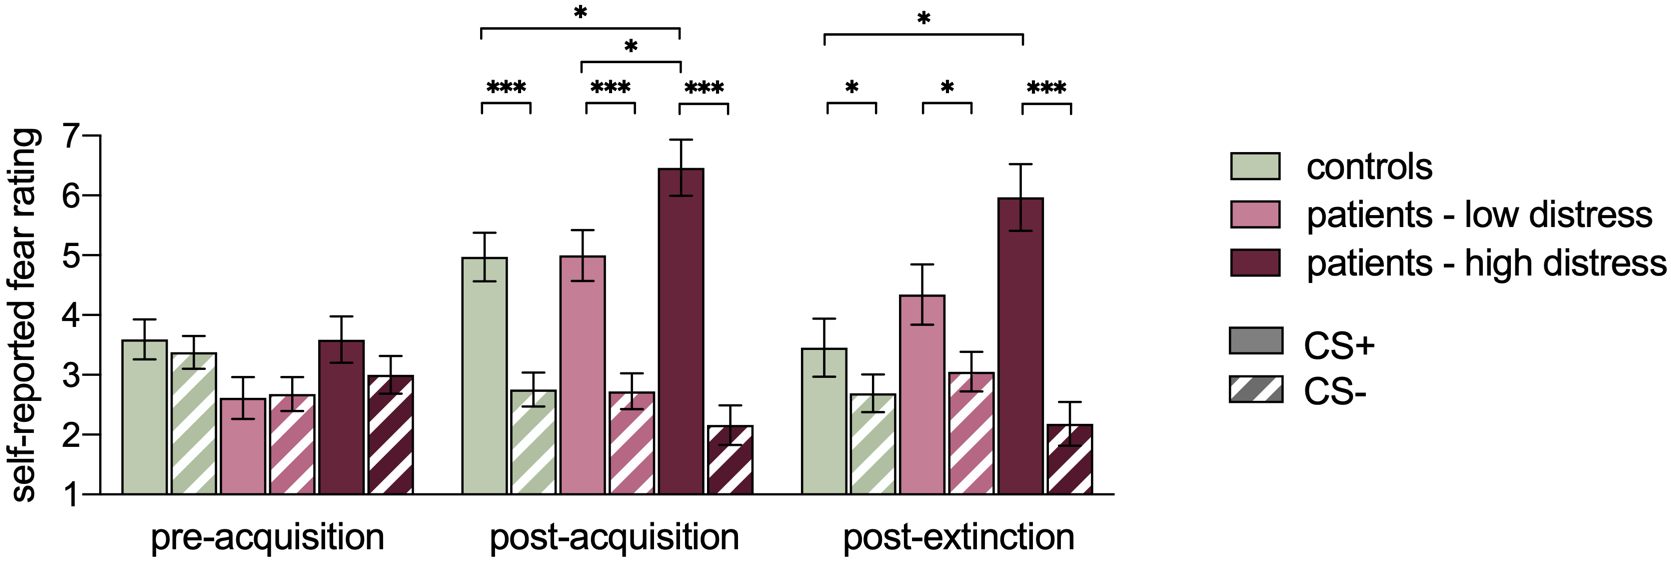
Self-reported fear ratings to the CS+ and CS- across groups and study phases. Significance values reflect decomposed simple effects following a significant three-way interaction. Main effects of group or stimulus not depicted for visual simplicity. * p < .05, *** p < .001. All p values Bonferroni corrected.