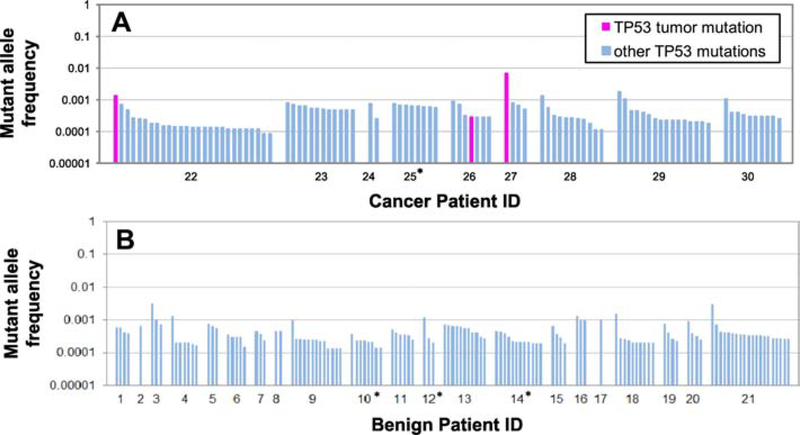
Figure 1: TP53 mutations identified in Pap tests. A. Women with HGSC. B. Women without cancer.
Each bar represents a TP53 mutation. For each patient, mutations are sorted by descending Mutant Allele Frequency (MAF). Note that all mutations have MAF<0.01 and most mutations have MAF<0.001. The three mutations that correspond to matching primary tumor mutations are indicated in fuchsia. Patient ID is indicated in the X-axis. The four patients with prior tubal ligations are indicated with an asterisk.

