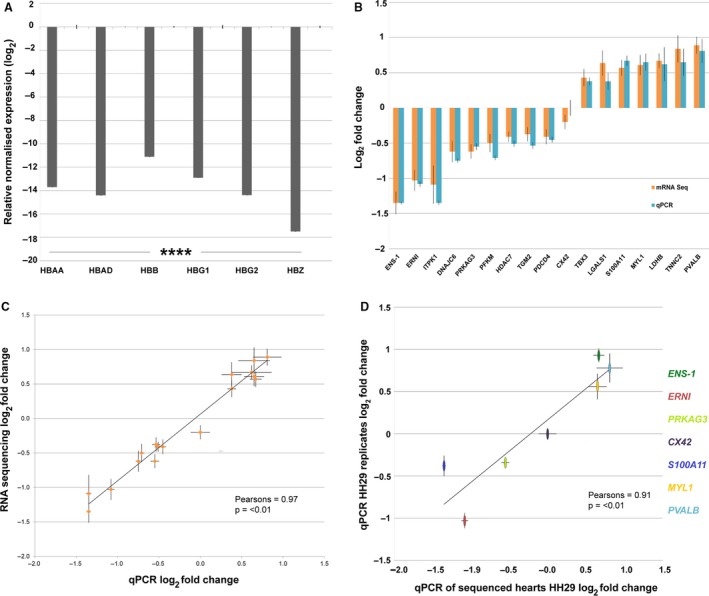
Figure 3.

Gene expression of globin‐depleted and sequenced hearts. (A) Relative expression of each globin‐depleted gene HBAA, HBAD, HBB, HBG1, HBG2 and HBZ in pooled globin‐depleted and non‐globin‐depleted hearts. Globin depleted samples significantly different to non‐globin‐depleted. Values are ±1 SEM (n = 6; ****P < 0.0001). (B) Gene expression of globin‐depleted and sequenced hearts, compared with the same hearts non‐globin‐depleted by qPCR. The lack of statistical differences shows that globin depletion/sequencing preparation does not effect gene fold change (FC) values: t(32) = 0.145, P = 0.78 (n = 17). RNA sequencing non‐corrected log2 FC was used for direct comparison with qPCR log2 FC. (C) Relationship of corrected (DESeq) RNA sequencing to qPCR. Results are highly correlated and show that qPCR generally gives a small increase in log2 FC when compared with RNA sequencing: r(16) = 0.97, P ≤ 0.0001) (n = 17). RNA sequencing DESeq corrected log2 FC compared with qPCR log2 FC. A closer parallel can be seen between non‐corrected RNA sequencing and qPCR log2 FC as seen in Supporting Information Fig. S5. (D) Relationship of gene expression of RNA‐sequenced hearts (n = 3 OFT‐banded, n = 3 sham) and new biological replicates (n = 3 OFT‐banded, n = 3 sham) at HH29 by qPCR. Statistically significant correlation of biologically independent samples is shown: r(5) = 0.91 (P ≤ 0.01).
