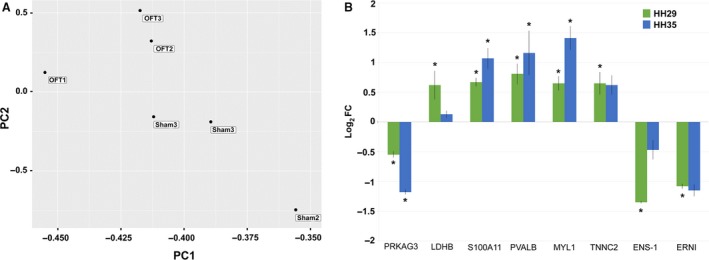
Figure 4.

OFT‐banded hearts show overall consistency of gene expression with targeted gene analysis showing differential expression at HH29 and HH35. (A) PCA of RNA sequencing FPKM shows consistency of expression within OFT‐banded (OFT) and sham groups, with a distinction seen between groups. (B) Expression analysis of targeted genes at HH29 and HH35 by qPCR shows a general increase in differential expression in OFT‐banded hearts, with the exception of LDHB and ENS‐1, where decreases are seen (*P < 0.05; significantly differentially regulated in OFT‐banded hearts by qPCR). HH29 data are from hearts used for RNA sequencing compared with data from isolated HH35 hearts (n = 3 OFT‐banded, n = 3 sham).
