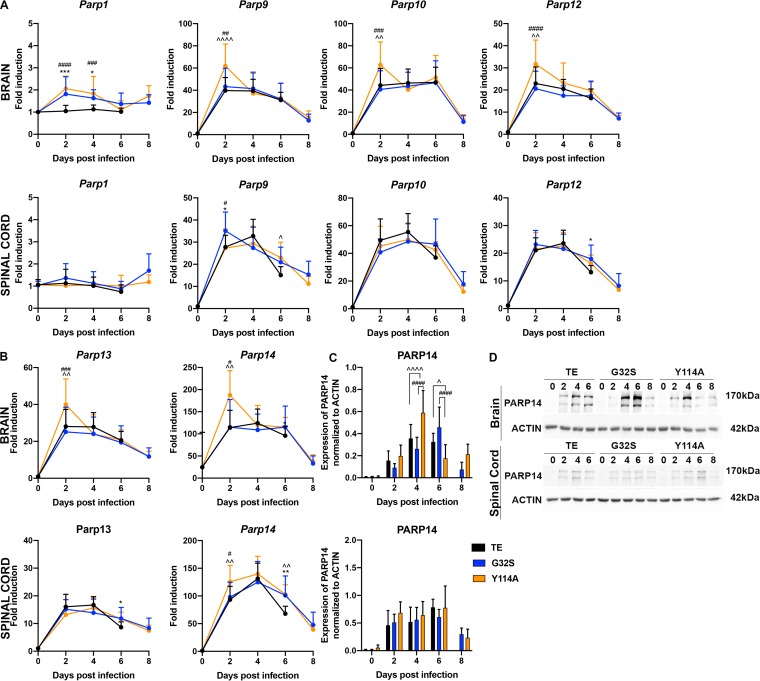
FIG 5.
Modulation of PARP mRNA and protein expression in the CNS of mice infected with WT and nsP3 MD mutants. Two-week-old CD-1 mice were inoculated intracranially with 1,000 PFU of SINV WT (TE) or nsP3 MD mutants G32S and Y114A. RNA was extracted from brain and spinal cord tissues and the expression of Parp1, Parp9, Parp10, and Parp12 (A) and of Parp13 and Parp14 (B) (upper panels, brain; lower panels, spinal cord) mRNAs were measured by qRT-PCR. CT values were normalized to Gapdh, and the fold change was calculated relative to samples from day 0 (ΔΔCT). Data pooled from two independent experiments are presented as means ± the SD for eight mice per group. Significance was determined by two-way ANOVA with Tukey’s multiple-comparison test. *, P < 0.05; **, P < 0.01; ***, P < 0.001 (WT versus G32S). ^, P < 0.05; ^̂, P < 0.01; ^̂̂̂, P < 0.0001 (WT versus Y114A). #, P < 0.05; ##, P < 0.01; ###, P < 0.001; ####, P < 0.0001 (G32S versus Y114A). (C) Immunoblots of brain and spinal cord homogenates (20 μg of 10% [wt/vol]) probed for PARP14. Antibody against β-actin was used for loading controls. The levels of PARP14 (170-kDa band) relative to actin in the brain (upper panel) and spinal cord (lower panel) were determined using densitometry from five blots for brain and four blots for spinal cord and presented as a bar graph. Significance was determined by 2-way ANOVA with Tukey’s multiple-comparison test. ^, P < 0.05; ^̂̂̂, P < 0.0001 (WT versus Y114A). ####, P < 0.0001 (G32S versus Y114A). (D) Representative immunoblot images of brain (upper) and spinal cord (lower) homogenates probed for PARP14 and actin.

