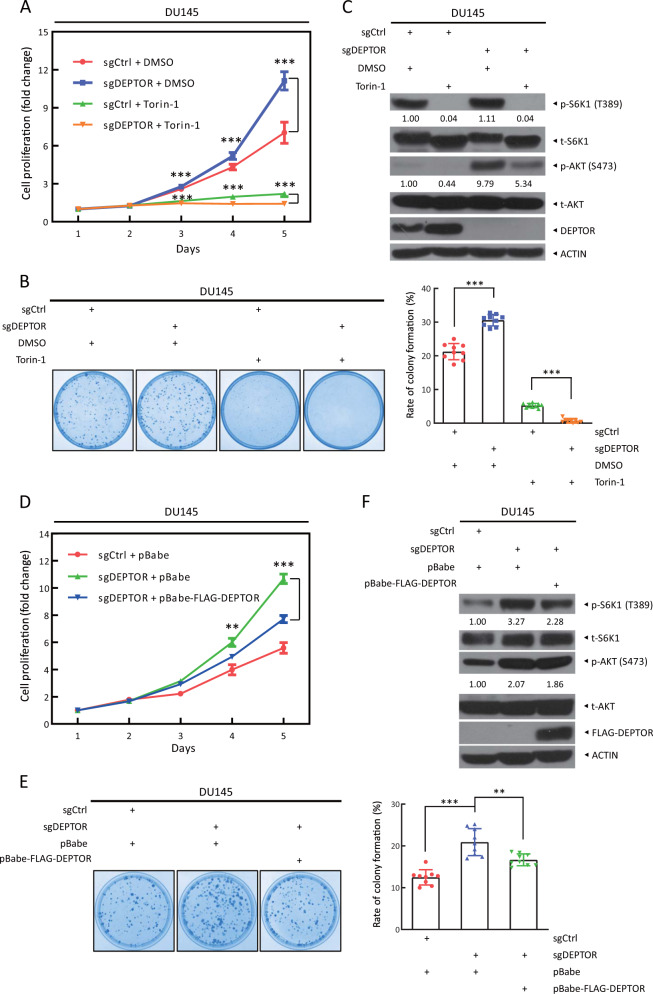
Fig. 3.
The cell proliferation and survival induced by DEPTOR knockout are abrogated by mTOR inhibitor Torin-1 and exogenous DEPTOR. a Torin-1 treatment abrogates the induction of cell proliferation by DEPTOR knockout. DU145 cells were seeded in 96-well plates in triplicate. Cells were treated with Torin-1 (100 nM) or were left untreated and were subjected to an ATPlite-based cell proliferation assay. Cell proliferation is expressed as the fold change compared with that at day 1. The mean ± SEM are shown from three independent experiments; n = 3; ***p < 0.001. b Torin-1 treatment abrogates the increased colony survival upon DEPTOR knockout. Cells were seeded in 60-mm dishes at 500 cells per dish and treated with DMSO or Torin-1 the following day. After 7–14 days, cell colonies were stained (left) and counted (right). The mean ± SEM are shown from three independent experiments; n = 3; ***p < 0.001. c mTOR activation upon DEPTOR knockout is blocked by Torin-1 treatment. Cells were treated with DMSO or Torin-1 for 12 h, followed by western blotting. d Exogenous DEPTOR expression abrogates the induction of cell proliferation by DEPTOR knockout. DU145 cells were infected with retrovirus expressing mock vector or DEPTOR, and then selected for stable expression with puromycin. Cells were seeded in 96-well plates in triplicate and then subjected to an ATPlite-based cell proliferation assay. Cell proliferation is expressed as the fold change compared with that at day 1. The mean ± SEM are shown from three independent experiments; n = 3; **p < 0.01; ***p < 0.001. e Exogenous DEPTOR expression abrogates the increase in colony survival upon DEPTOR knockout. Cells were seeded in 60-mm dishes at 500 cells per dish. After 7–14 days, cell colonies were stained (left) and counted (right). The mean ± SEM are shown from three independent experiments; n = 3; **p < 0.01; ***p < 0.001. f mTORC1 activation upon DEPTOR knockout is blocked by exogenous DEPTOR expression. Cells were harvested for western blotting using the indicated antibodies. The band density was quantified and expressed as the relative gray value (compared with the control), by arbitrarily setting the control value as 1

