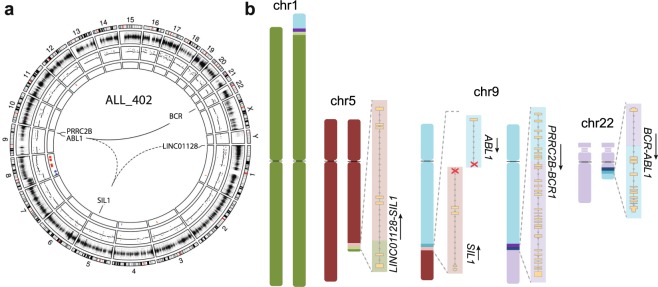
Figure 3.
Complex structural rearrangements in the patient ALL_402. (a) A circos plot depicting the genome-wide copy number changes in ALL_402. The first (outer) track shows each chromosome and their banding, the second track shows log R ratios from infinium arrays, the third track shows copy number determined by linked-read WGS in 10 Kb bins, and the fourth (innermost) track shows copy number calls using the CNVnator software. Red indicates gain and blue indicates deletion. Expressed fusion genes are highlighted inside of the circos plot, solid lines indicate in-frame and dashed lines indicate out of frame fusion or truncated genes. (b) The derivative chromosomes as outlined using linked-read WGS. The structures of the expressed fusion genes are shown alongside their derivative chromosomes with the direction of transcription indicated by arrows.

