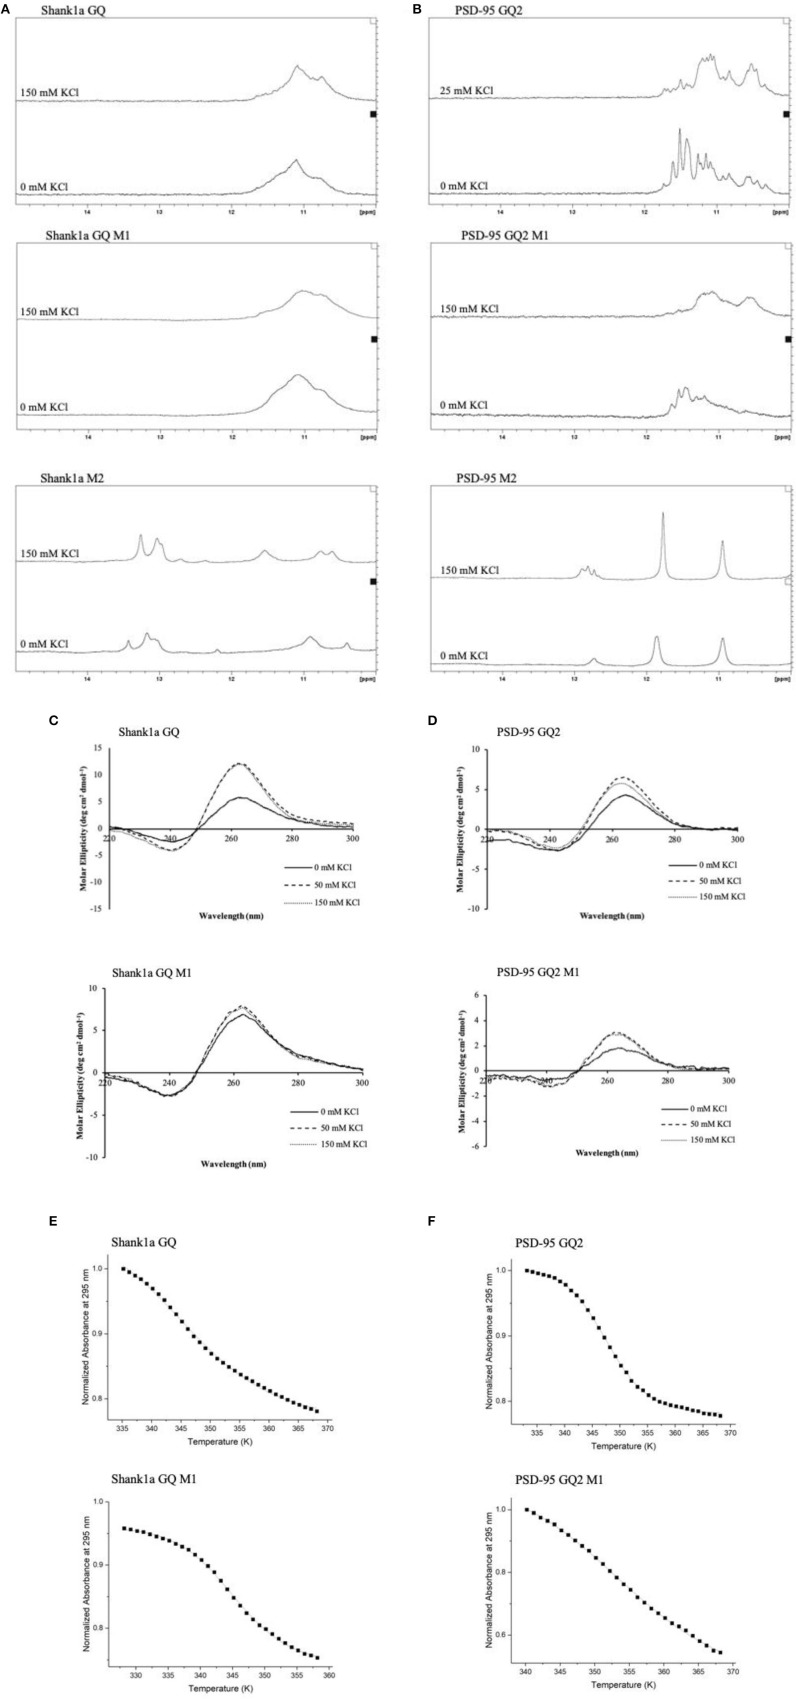
Figure 3.
1H NMR spectra of Shank1a GQ WT (A, top panel), Shank1a GQ M1 (A, middle panel), Shank1a M2 (A, bottom panel), PSD-95 GQ2 WT (B, top panel), PSD-95 GQ2 M1 (B, middle panel), and PSD-95 M2 (B, bottom panel). Both WT and M1 mutant sequences for Shank1a GQ and PSD-95 GQ2 show imino proton resonances between 10 and 12 ppm indicative of GQ formation, whereas spectra for the M2 mutant sequences do not. CD spectra of Shank1a GQ WT (C, top panel), Shank1a GQ M1 (C, bottom panel), PSD-95 GQ2 WT (D, top panel) and PSD-95 GQ2 M1 (D, bottom panel) display a positive band at 265 nm and a negative band at 240 nm, indicating that the parallel GQ fold was maintained for all sequences. UV-thermal denaturation profiles for Shank1a GQ WT (E, top panel), Shank1a GQ M1 (E, bottom panel), PSD-95 GQ2 WT (F, top panel), and PSD-95 GQ2 M1 (F, bottom panel). Shank1a GQ mutant was denatured in the presence of 2.5 mM KCl and 10 mM cacodylic acid, pH 6.5. PSD-95 GQ2 mutant was denatured in the presence of 0.5 mM KCl and 10 mM cacodylic acid, pH 6.5. Hypochromic transitions were fit using Equation (1) (Materials and Methods).

