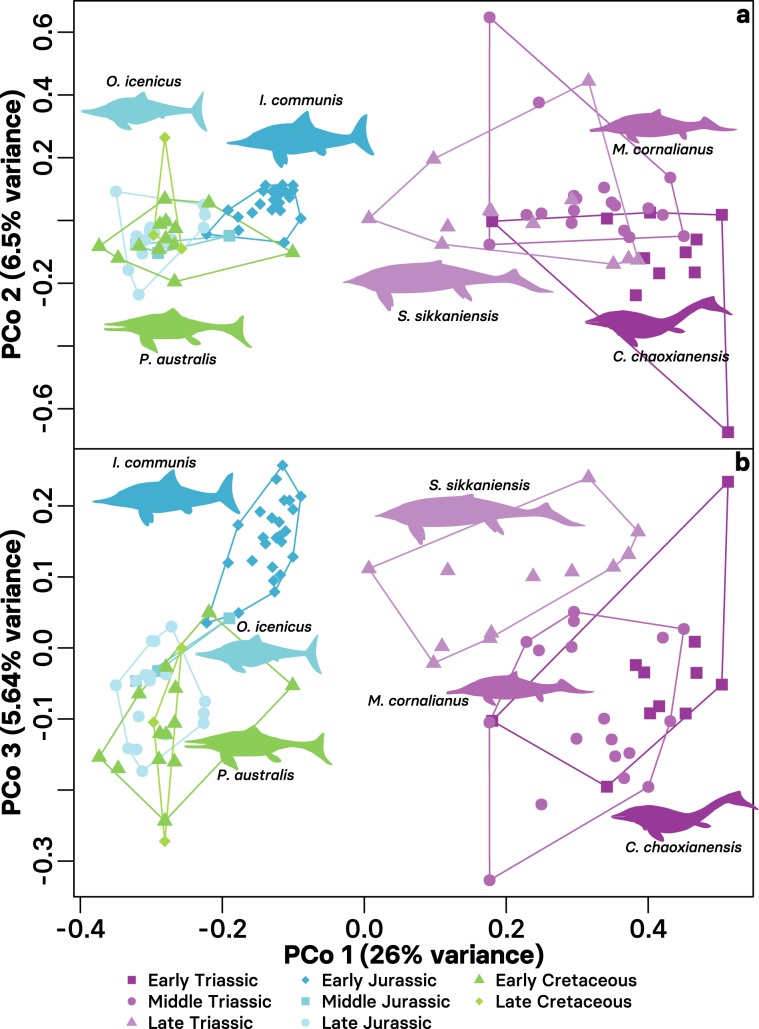
Fig. 2. Morphospace occupation of Ichthyosauriformes through the Mesozoic.
a Principal coordinate axis 1 (26.0% of total variance) against axis 2 (6.5% of total variance). b Principal coordinate axis 1 against axis 3 (5.64% of total variance). Ordinated maximum observed rescaled distance matrix calculated from the cladistic data set of Moon20 binned into epochs. Silhouettes of indicative taxa (Grippia longirostris [D. Bogdanov, vectorized by M. Keeley], Ichthyosaurus communis [G. Monger], Mixosaurus cornalianus [G. Monger], Ophthalmosaurus icenicus [G. Monger], Platypterygius sachicarum [Zimices], and Shastasaurus sikkaniensis [G. Monger]) show their relative positions. Images downloaded from PhyloPic and used under a CC-BY 3.0 licence: https://creativecommons.org/licenses/by/3.0/.

