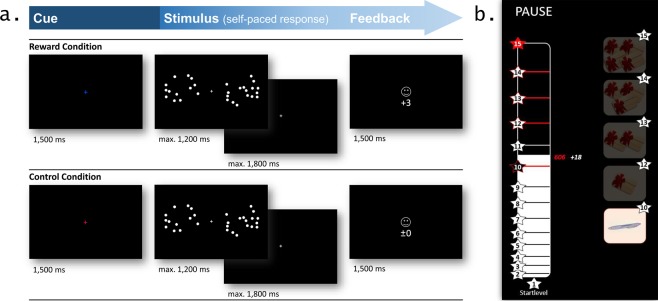
Figure 1.
Schematic representation of the experimental task: (a) Trial scheme of the incentivized dot comparison task depicting the three phases (i.e., incentive cue, stimulus, feedback) of a correctly answered trial for both the reward (top) and the control (bottom) condition; (b) Scoring scheme shown after each block giving an overview about the points the participant collected in reward trials during the last block (white number) and the accumulated total points (red number and white bar) as well as the obtained bonus winning level (levels 1–15) and the corresponding items (pencil or vouchers; right panel) the participant had already won (see Methods section for more details about the task).

