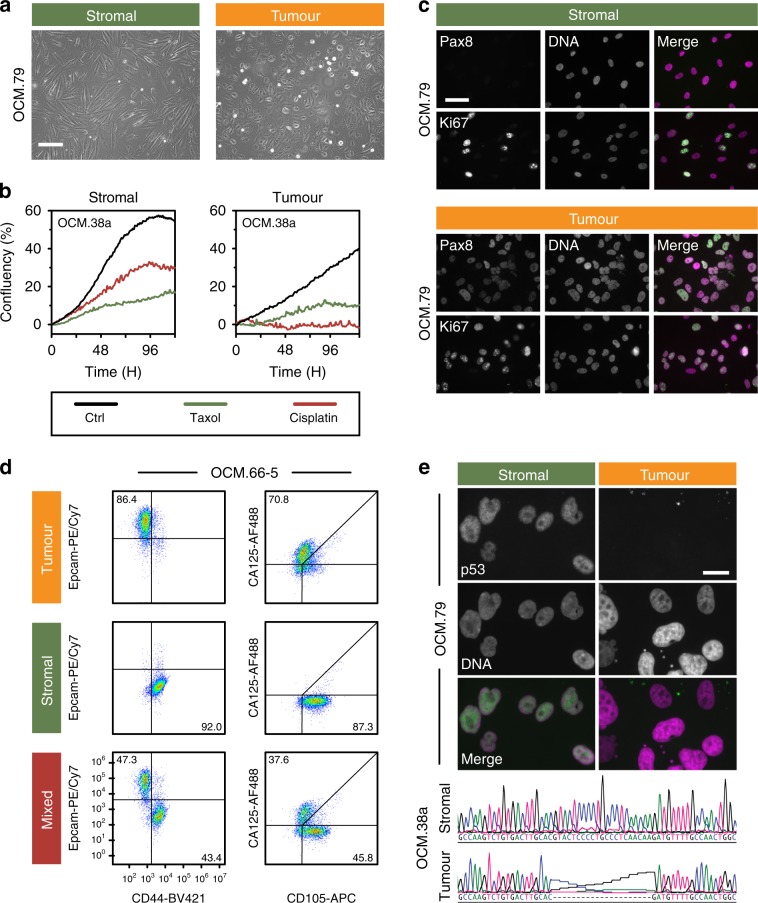
Fig. 2. Characterisation of ex vivo models.
a Phase contrast images showing distinct morphologies of stromal and tumour cells. Scale bar, 200 µm. b Time-lapse imaging measuring confluency showing suppression of proliferation by 1 µM cisplatin and 100 nM paclitaxel. c Immunofluorescence images showing expression of PAX8 and Ki67. Scale bar, 50 µm. d Flow cytometry profiles quantitating the tumour markers EpCAM and CA125, and the stromal markers CD44 and CD105. Numbers represent percentage of cells in the quadrant. e Immunofluorescence images of Nutlin-3-treated cells (OCM.79) showing stabilisation of p53 in stromal cells but not tumour, and DNA sequence showing TP53 mutation in tumour cells (OCM.38a). Scale bar, 20 µm. Data in panels a and c are derived from analysis of OCM.79, while data in panels b and d are derived from analysis of OCMs 38a, and 66-5 respectively. Panels a, c and e are representative images from single experiments. Source data for panels b, c and d are provided as a Source Data file, including the gating/sorting strategy for panel d. See also Supplementary Figs. 1 and 2.

