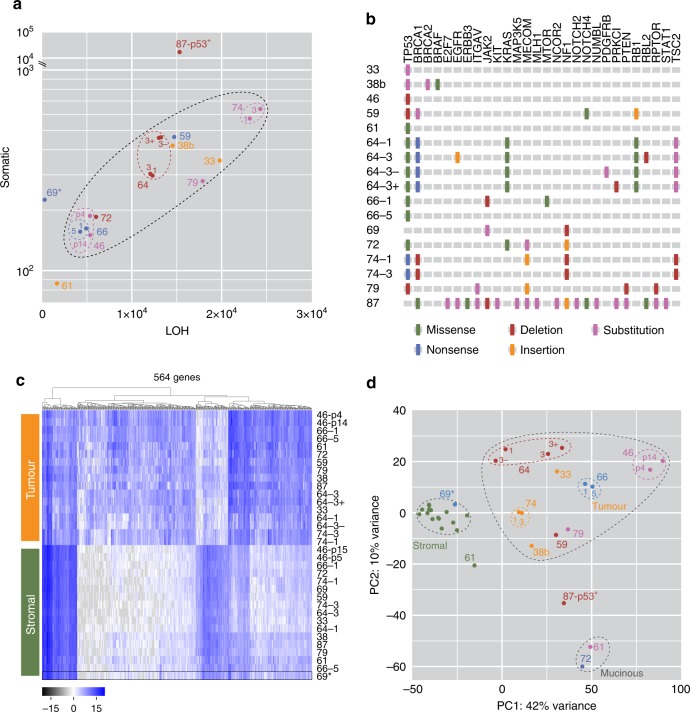
Fig. 3. Exome and gene expression analysis.
a Whole-exome sequencing showing somatic and loss of heterozygosity variants identified by referencing tumour cells to their matched stromal counterparts. b Summary of mutations in genes associated with HGSOC. c Hierarchical clustering and d principal component analysis of global gene expression profiles, distinguishing stromal and tumour clades, and showing the close relationship of tumour samples from the same patient. 69* is a stromal culture. Symbol colours in a and d serve to distinguish different OCM tumour samples. Source data for panels a and d are provided as a Source Data file.

