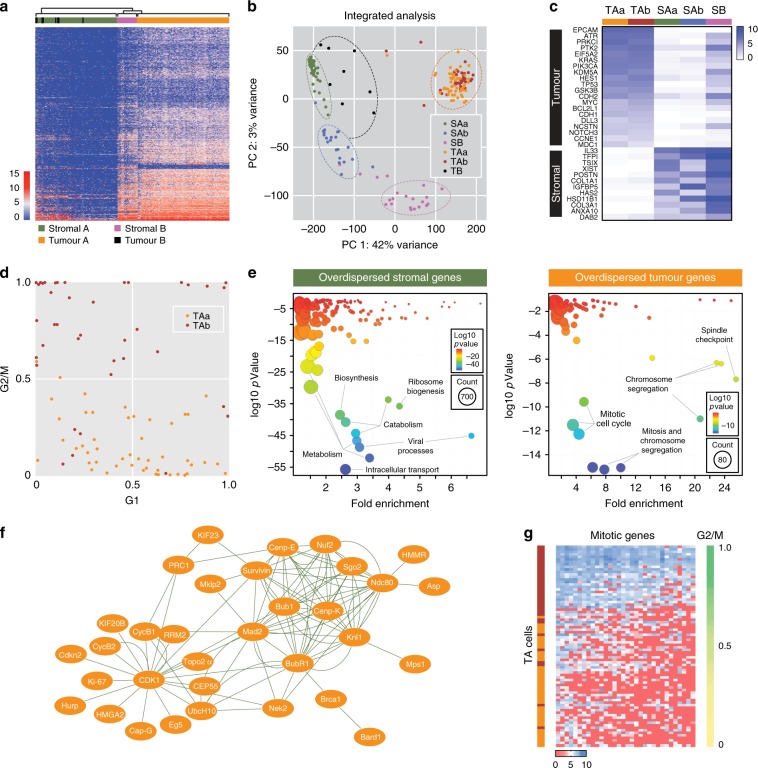
Fig. 4. Fluidigm single-cell transcriptomics.
a Hierarchical clustering of gene expression profiles distinguishing stromal and tumour cells from chemo-naïve OCM.38a. b Principal component analysis integrated with pathway analysis showing subpopulations of tumour and stromal cells. c Heat map showing mean expression levels of selected genes in OCM.38a tumour and stromal sub-populations. d Scatter plots of G1 score versus G2/M score for individual cells within the TAa/TAb sub-populations. e Gene ontology analysis of overdispersed genes in stromal and tumour cells. f Network analysis of overdispersed genes in tumour cells. g Heat map of overdispersed genes showing that TAb cells expressing higher levels of mitotic genes and have high G2/M scores. Source data for panels b–e and g are provided as a Source Data file.

