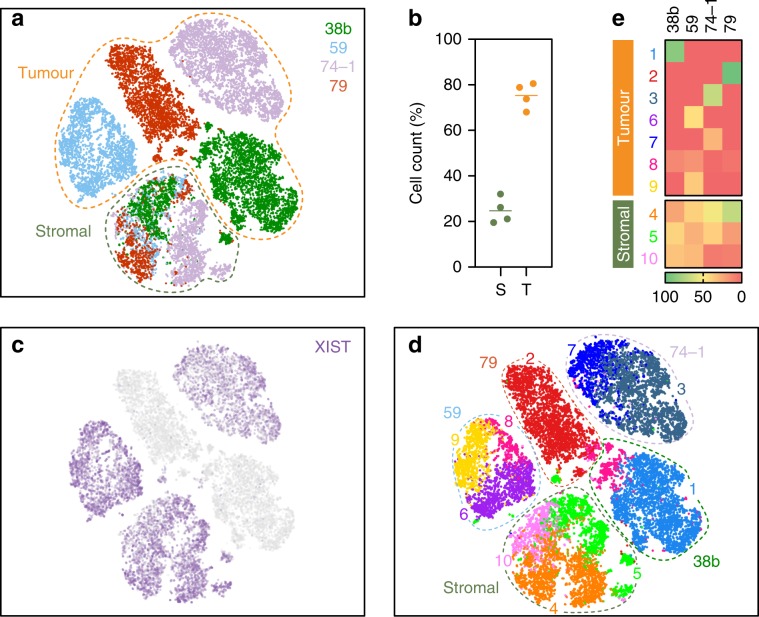
Fig. 5. 10x Genomics single-cell transcriptomics.
a t-Stochastic neighbour embedding (t-SNE) plot showing clustering of single cells from four OCM pairs, with tumour and stromal cells mixed 3:1. b Dot plots quantitating the percentage of cells in the stromal and tumour clusters. Line represents the mean (N = 4 biological independent samples i.e. n = 1 for each of the four OCMs). c, d t-SNE plot from a overlaid with XIST expression (c) and 10 sub-populations identified by hierarchical clustering (d). e Heat maps quantitating the percentage of cells from each patient sample in the 10 sub-populations. Source data for panels b and e are provided as a Source Data file.

