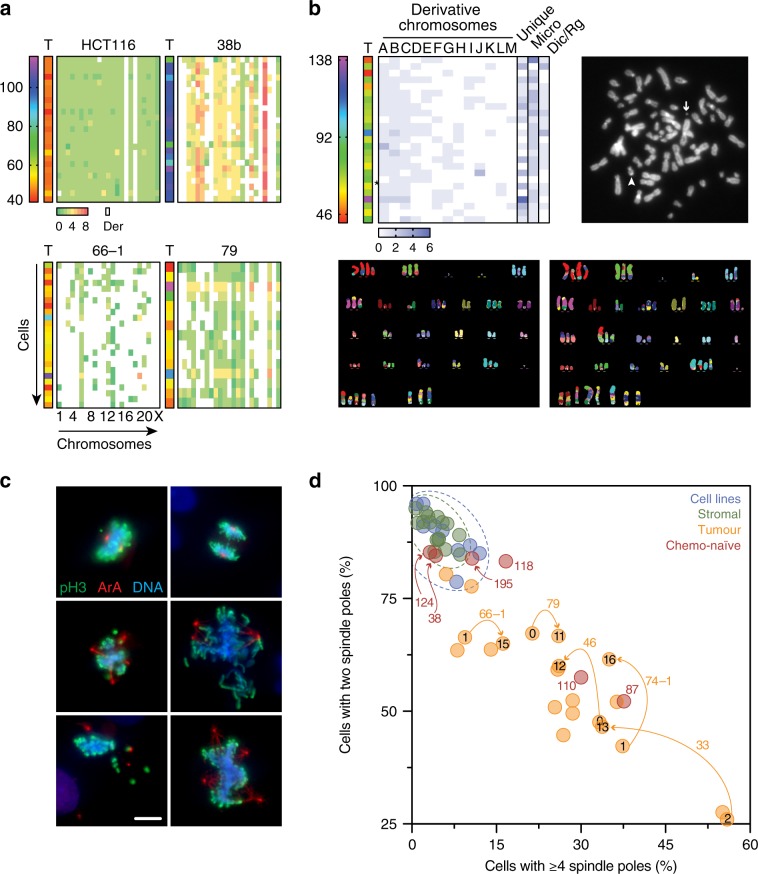
Fig. 7. M-FISH karyotyping.
a Heat maps quantitating total chromosome count (T, range 40–>100) and individual chromosome counts (matrix, range 0–8), for OCMs 38b, 66–1 and 79, enriched for tetraploidy, rearranged chromosomes and whole-chromosome aneuploidy features respectively. Derivative chromosomes indicated by white. HCT116, a near-diploid, stable cell line with two derivative chromosomes, is shown for comparison. b M-FISH analysis of OCM.59. Heat map, exemplar chromosome spread and two exemplar M-FISH images. Heat map shows total chromosome count (T) and individual chromosome counts (matrix, range 0–6), quantitating recurring derivatives (A to M), unique derivatives (U), DNA fragments and micro-chromosomes (Micro), and other abnormal structures including dicentrics and ring chromosomes (Dic/Rg). The chromosome spread shows a micro (arrow) and dicentric (arrowhead) chromosome while the M-FISH images show whole chromosome aneuploidies, rearranged chromosomes and different derivatives. c Immunofluorescence images of cells stained to detect phospho-histone H3 (serine 10), Aurora A and the DNA (representative images from single experiment). Scale bar, 10 µm. d Quantitation of mitotic spindle poles in stromal cells, OCM tumour cells and nine established cell lines. Numbers outside the symbols indicate OCM culture while numbers inside the symbols indicate passage number. Orange arrows connect tumour samples from the same OCM culture analysed at different passages. Source data for panels a, b and d are provided as a Source Data file.

