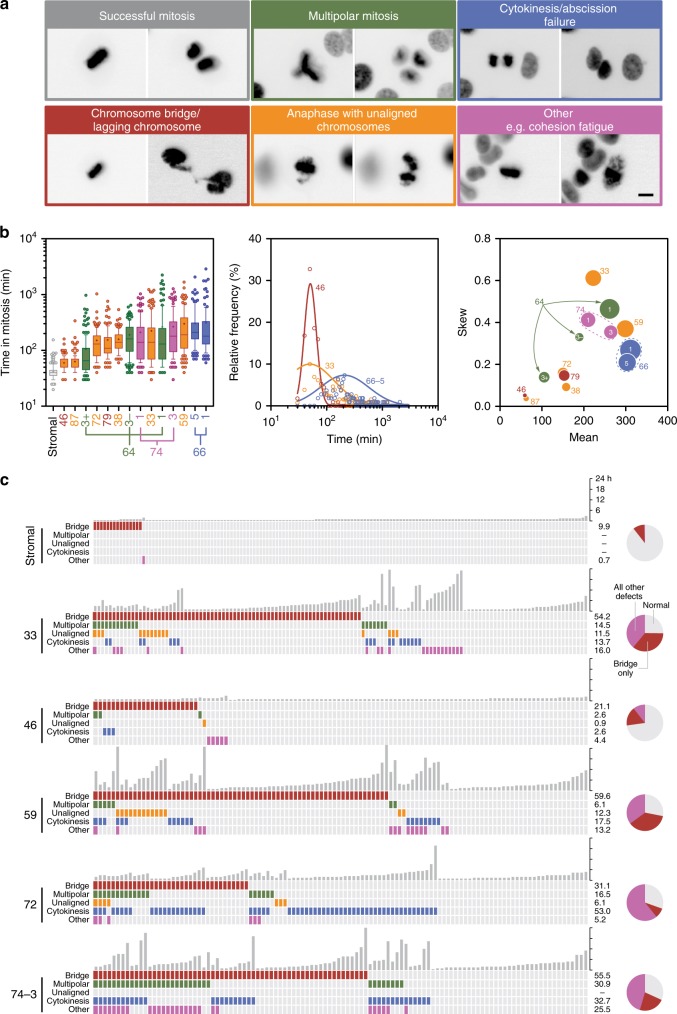
Fig. 8. Time-lapse microscopy.
a Examples of abnormal mitoses in tumour cells expressing GFP-H2B, showing images before and after anaphase onset (representative images at multiple positions from single experiment). Scale bar, 10 µm. b Analysis of time spent in mitosis, at least 100 cells measured from nuclear envelope breakdown to anaphase onset. Rank ordered box-and-whisker plot with boxes, whiskers and “+” showing the interquartile range, 10–90% range, and mean respectively. Line graph showing linear regression of the frequency distributions for OCMs 33, 46 and 66–5. Bubble plot of Hougaard’s skew against the mean, with bubble size proportional to the variance. c Quantitation of mitotic anomalies with each column representing one cell and the vertical grey bars representing the time each cell spent in mitosis. Pie charts show the number of normal mitoses, those with anaphase bridges only and all other defects combined. Note that the stromal data is compiled from three cultures, namely OCMs 33, 66 and 79. See also Supplementary Fig. 4. Source data for panels b and c are provided as a Source Data file, including number of biological independent samples for each OCM in panel B.

