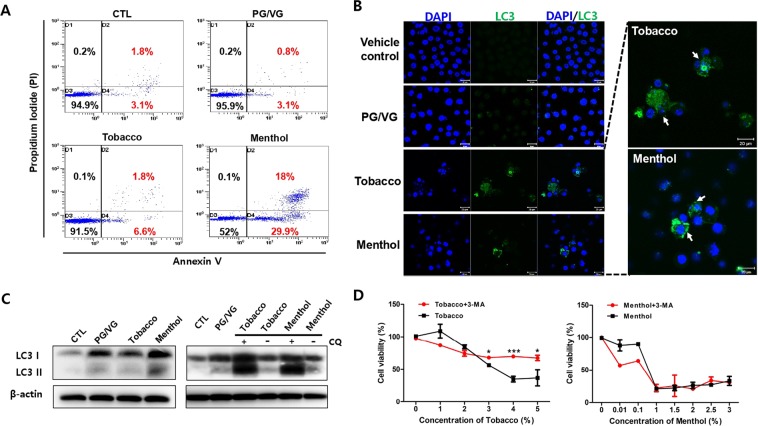
Figure 5.
E-liquids induced apoptosis signaling in HMEECs. (A) HMEECs were exposed to e-liquids at the IC50 concentration for 24 h (PG/VG: 4.5%, Tobacco: 3.3%, and Menthol: 1.5%), and FACS was used to analyze apoptotic cells stained by annexin V-FITC/PI (blue dots). Apoptotic- and necrotic-positive cells (positive staining) were higher in the group treated with the menthol-flavored e-liquid than in the other groups. (B) Representative confocal microscopic images of LC3 expression in HMEECs after treatment with e-liquids (PG/VG: 4.5%, Tobacco: 3.3%, and Menthol: 1.5%) or without treatment for 24 h. LC3 expression (green) in cells was higher in e-liquid-treated groups than in the control group. Nuclei were counterstained with DAPI (blue). (C) Western blotting analysis of LC3 expression in HMEECs treated with PG/VG (4.5%), tobacco- (3.3%) and menthol- (1.5%) flavored e-liquids in the absence or presence of 10 μM CQ for 1 h. Cells were pre-treated with CQ for 1 h. LC3 II was significantly accumulated in cells treated with tobacco- and menthol-flavored e-liquids. Equal protein loading was verified and normalized to β-actin levels. (D) HMEECs were pre-treated with 3-MA (5 mM) for 1 h, and then, tobacco- and menthol-flavored e-liquids (Tobacco: 3.3%, and Menthol: 1.5%) were added at the indicated concentrations for 24 h (0.01 to 5%). Cell viability assay was performed by CCK8 method as described in Materials and Methods section. More prominent inhibition of autophagy restored cell viability of tobacco-flavored e-liquid treated group compared with menthol-flavored e-liquid. All data were obtained from three independent experiments and the error bars indicate the mean ± SD. **p < 0.01 and ***p < 0.001 compared to the corresponding control.

