Figure 2.
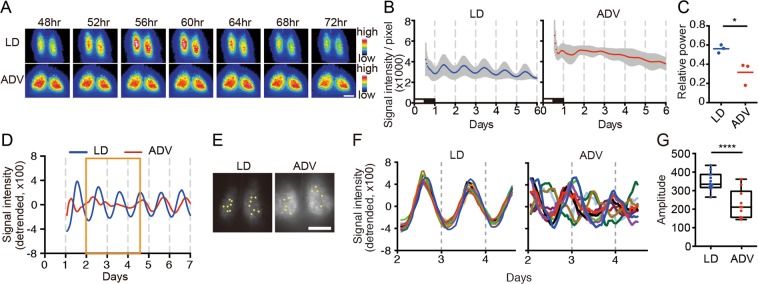
The long-term non-adjustive ADV-condition desynchronized SCN neurons. (A) Representative bioluminescence images of SCN slice culture from Per2Luc mice under the indicated conditions for ~1 year. The animals were sampled at ZT12 on the second day after the shift. Hours indicate time after the last light onset. Scale = 200 µm. (B,C) Averaged bioluminescence traces from SCN slice cultures (mean ± SD, n = 3) and the FFT spectral analysis of the traces. Two-tailed Student’s t-test, *P < 0.05. Black and white bars show the animal’s previous LD conditions. (D) The detrended data of whole bioluminescence traces of the SCN slice culture from the indicated conditions. Orange boxes indicate the duration used for the single-cell level analysis. (E) ROIs for single-cell bioluminescence traces were represented in SCN images from each condition. LD, n = 14; ADV, n = 10. Scale = 250 µm. (F,G) The detrended traces at the single-cell level and the amplitude of the detrended traces. Two-tailed Student’s t-test, ****P < 0.0001.

