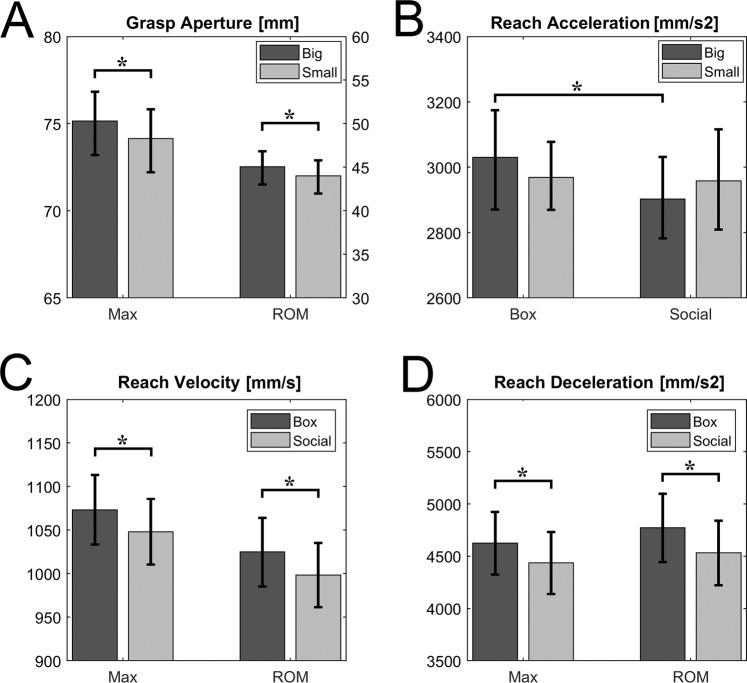
Figure 3.
Panel A reports the variables whose main effect SIZE resulted significant for both max values and range of motion. Left Y axis refers to max values, the right one to ROM values. Panels C and D show the variables whose main effect CONTEXT resulted significant for both max values and range of motion. Asterisks indicate a significant p-value at the ANOVA main effect (p < 0.05). Panel B shows the significant SIZE × CONTEXT interaction effect relative to the Reach Acceleration Mean. Asterisk indicates the significant post-hoc comparison between Big Box and Big Social (p < 0.05).

