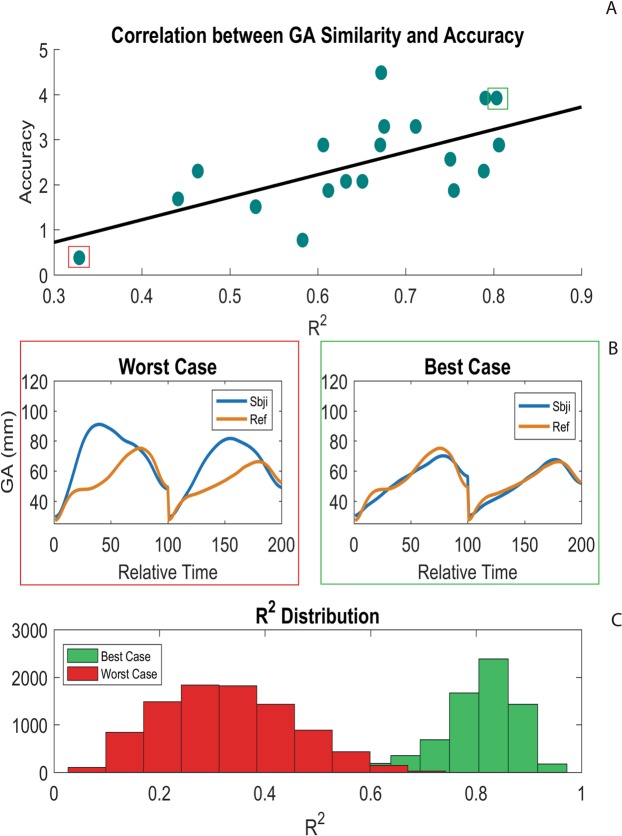
Figure 4.
Similarity-Accuracy correlation (r = 0.65) relative to the grasp aperture in the non-social condition (Big Box vs. Small Box). (A) Blue dots indicate [R2-accuracy] for each subject, while black line indicates the linear trend of this distribution (yaccuracy = 5.00(xSI) − 0.80). (B) For two representative subjects (worst and best cases in terms of accuracy), the average kinematic curves of the participant (blue line) and of the reference subject (orange line) are shown. (C) R2 distributions among all individual trials are reported for the worst (red bars) and the best (green bars) subjects.

