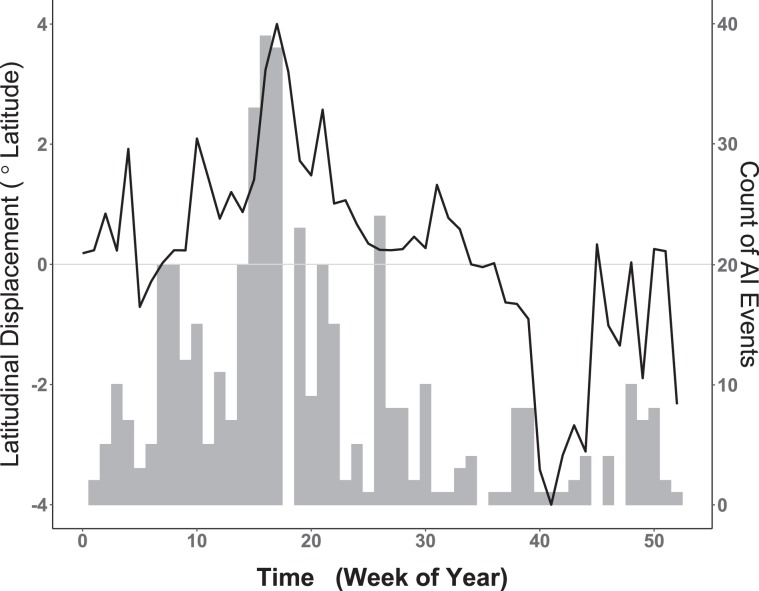
Figure 3.
Weekly comparison of historic AI Events (AIPs) with waterfowl latitudinal displacement. Left vertical axis corresponds to smooth black line and represents weekly latitudinal displacement of waterfowl measured in degrees latitude. Horizontal axis provides the week of year. Dotted line intersecting zero signifies no net waterfowl displacement, with portions above zero indicating relative northward movement and portions below showing net southward change. Vertical axis at right corresponds to gray histogram for the weekly counts of all AIP summed over the period 2004–2019. Note apparent temporal correlation between waterfowl spring migration (Weeks 5–18) and increasing AIP as well as that between fall migration (weeks 35–42) and decreased AIP counts.

