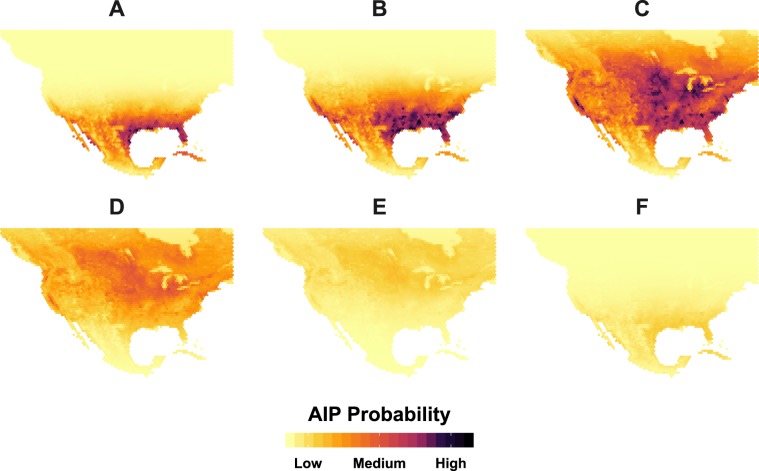
Figure 7.
Mapped AIP probabilities predicted by joint-model (Model5). Weeks 7, 15, 18, 23, 33, and 51 of the year are labeled as A through F respectively. Color coding and legend reflect relative probability (0.00–1.00) of H5 or H7 occurrence in North American Poultry with darker colors signifying increased likelihood. Note that C representing week 18 of the year (late April – early May) was predicted to exhibit the greatest AIP probability.

