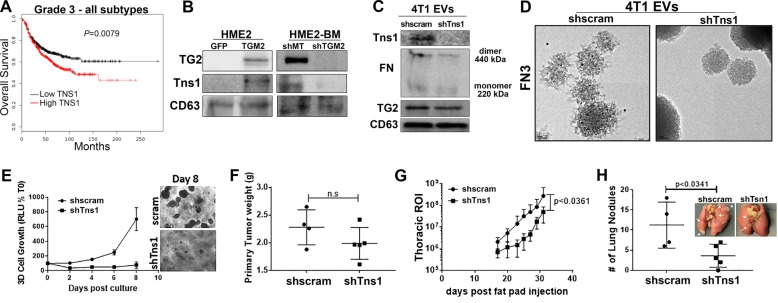
Fig. 6. Tensin-1 is required for fibronectin fibrillogenesis on EVs.
a Comparison of overall survival between patients bearing grade 3 tumors expressing levels of TNS1 above (high) or below (low) the mean level for the entire patient cohort. Survival curves were analyzed via a log-rank test resulting in the indicated p value. b Immunoblot analyses of EVs collected from control (GFP) and TG2-overexpressing HME2 (TGM2) as well as control (shMT) and TG2-depleted (shTGM2) HME2-BM cells. Lysates from these EVs were assessed for the levels of TG2 and TNS1, and the levels of CD63 served as a loading control. c Immunoblot analyses of EVs derived from control (shscram) and Tns1-depleted (shTns1) 4T1 cells. Lysates from these EVs were assessed for the levels of TG2 and Tns1, and the levels of CD63 served as a loading control. d The fibrillar FN-specific (FN3) antibody was used in conjunction with immuno-electron microscopy to analyze nonpermeabilized EVs derived from control (shscram) and Tns1-depleted (shTns1) 4T1 cells. e Control (shscram) and Tns1-depleted (shTns1) 4T1 cells were grown under single-cell 3D culture conditions. Cellular outgrowth was quantified by bioluminescence at Day 8. Data are normalized to the plated values and are the mean ± SD of three independent analyses resulting in the indicated p value. f Control (shscram) and Tns1-depleted (shTns1) 4T1 cells were engrafted onto the mammary fat pad, and the resultant primary tumors were removed and weighed upon necropsy. g Quantification of bioluminescent radiance from the thoracic regions of interest (ROIs) at the indicated time points. h Upon necropsy, the numbers of pulmonary metastatic nodules were quantified. (Inset) Corresponding gross anatomical views of lungs from control (shscram) and Tns1-depleted (shTns1) 4T1 tumor-bearing mice. Data in f–h are mean ± SE values from five mice per group resulting in no significance (n.s.) or the indicated p values.

