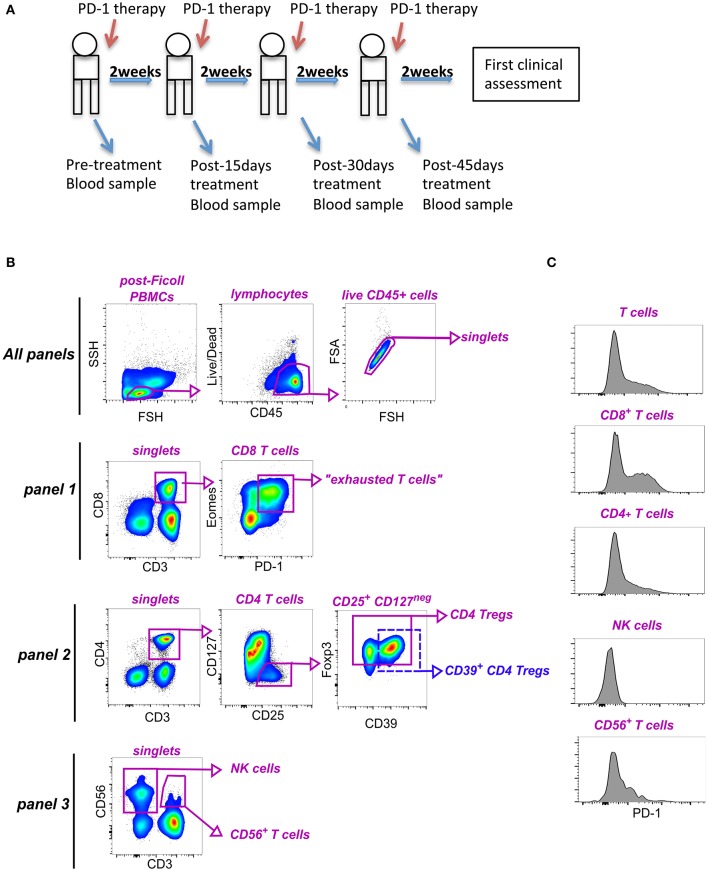
Figure 1.
Identification of lymphocyte subpopulations in blood of NSCLC patients. (A) Study design. (B) Representative gating strategy to identify subsets within PBMCs for immunophenotyping analyses. As shown in the very top row, all data files were first preprocessed to include only CD45+ live cells, as well as, singlet events. The remaining gating hierarchy for each of the panels is shown. Panel 1 was used to identify CD8+ T cells and exhausted (PD-1+ Eomes+) T cells (antibodies: CD3, CD8, Eomes, PD-1). Panel 2 allowed characterization of CD4+ T cells, as well as total and CD39+ Foxp3+ Tregs (antibodies CD3, CD4, CD127, CD25, CD39, PD-1, Foxp3). Panel 3 was used to characterize NK cells and CD56+ CD3+ T cells (antibodies used: CD3, CD56, PD-1). (C) Histograms showing expression of PD-1 on CD3+ T cells, CD8+ T cells, CD4+ T cells, CD3+ CD56+ T cells and NK cells from one representative patient.

