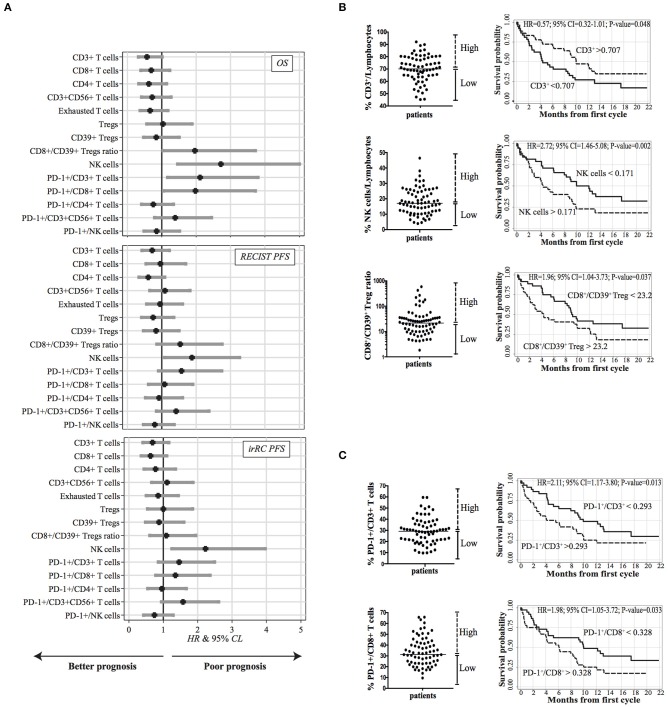
Figure 2.
Correlation between baseline PB lymphocyte subsets and survival (n = 73). (A) Caterpillar plots showing the impact of each immune biomarker evaluated at baseline on overall survival (OS), RECIST, and irRC PFS. HR and corresponding 95% CL were derived from a Cox regression analysis adjusted for gender, age at enrollment, time since diagnosis, ECOG-PS, number of previous treatments and histotype. Vertical line at HR = 1 divides HR associated with a better prognosis (left side) from those associated with a worsen prognosis (right side). (B) Kaplan-Meier survival curves illustrating the prognostic effect on OS of CD3+ T cells and CD56+ CD3− NK cells frequencies, and CD8+/CD39+ Treg ratio for patients with higher (dotted lines) and lower (solid lines) values. (C) Kaplan–Meier survival curves for patients with high or low expression of PD-1 on CD3+ T cells and on CD8+ T cells. (B,C) The median values used as thresholds for categorizing immune biomarkers are indicated in the scatter plots on the left side of each curve.

