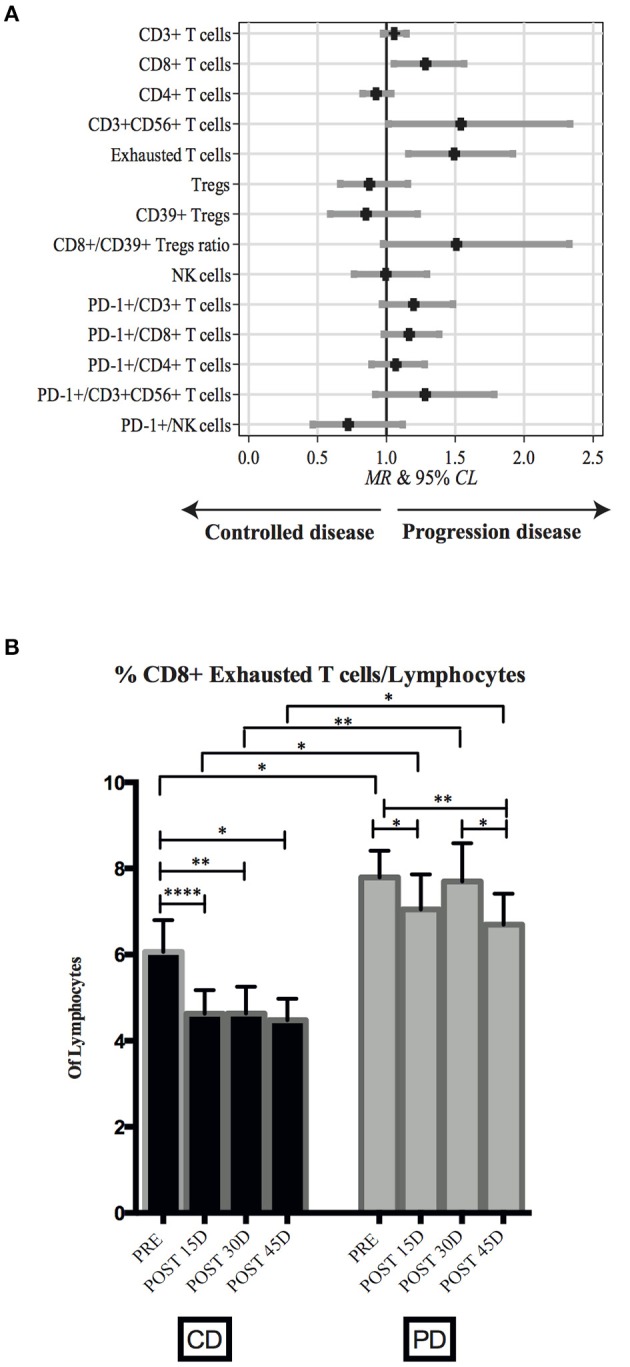
Figure 4.

Changes in PB lymphocyte subsets during nivolumab treatment. (A) Caterpillar plot showing the relationship between CD vs. PD patients on the longitudinal profile of all immune biomarkers. Median ratio (MR) and corresponding 95% CL were derived from a random effects regression analysis adjusted for gender, age at enrollment, time since diagnosis, ECOG-PS, number of previous treatments, and histotype. Vertical line at MR = 1 divides MR associated with a controlled disease (left side) from those associated with a progressive disease (right side). (B) Frequency of exhausted CD8+ T cells assessed at four different time points, Pre-treatment (n = 54), post 15D (n = 48), post 30D (n = 45), and post 45D (n = 48) in CD and PD patients. Bars represent mean values ±SD. Mann-Whitney test (statistical comparisons between CD and PD groups) or paired non-parametric Wilcoxon test (statistical comparisons within each group) was used for statistical analyses. *p < 0.05, **p < 0.01, ****p < 0.0001.
