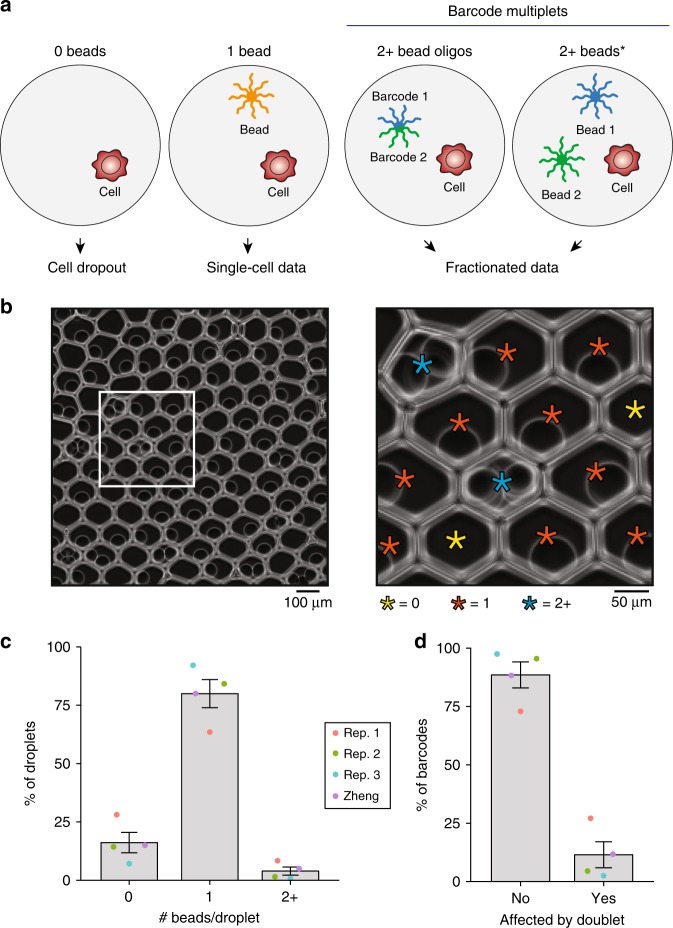
Fig. 1. Quantification of barcode multiplets from multiple beads in 10× Chromium platform.
a Schematic of bead loading variation and phenotypic consequences. Droplets with 0 beads fail to profile nucleic acid from the loaded cell (“dropout”) whereas barcode multiplets fractionate the single-cell data. Barcode multiplets can be generated by either heterogeneous barcodes on an individual bead or two or more beads loaded into the same droplet. The * indicates the bead multiplet that can be quantified via imaging. b Representative example of beads loaded into droplets from the 10× Chromium platform. The white box is magnified 3× for the panel on the right, revealing multiple beads loaded into droplets. Stars indicate beads (except 0) and are colored by the number of beads contained in the droplet. The image is representative of a total of 30 fields of view taken from three independent experiments. c Empirical quantification of number of bead barcodes based on image analysis over 3 replicates with previously published data (Zheng et al.2). d Percent of barcodes associated with multiplets under the distribution observed in c. Error bars represent standard error of mean over the experimental replicates. Source data are available in the Source Data file.

