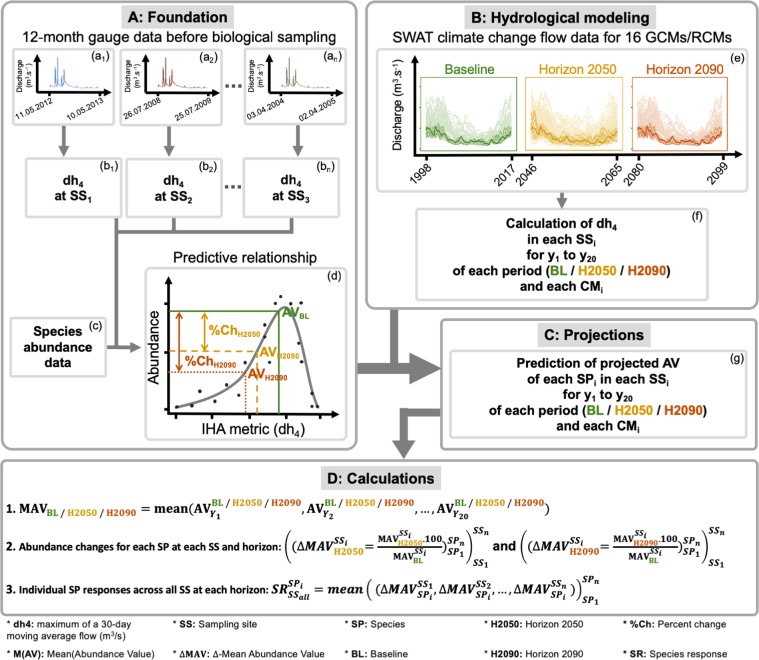
Figure 2.
Workflow schematic of the analyses of both individual species and a single climate model57. We employed the predictive relationship (A) established by Kakouei et al.13 and employed only the dh4 IHA metric for each sample (b), using 12-month time-series gauge data collected before the date of biological sampling (a). Using the time-series discharge data that were provided for each of the 16 GCMs and RCMs (e), dh4 (f) was calculated for each year during the baseline (BL, e), horizon 2050 (H2050, e) and horizon 2090 (H2090, e) and then used to predict the projected abundance values (AV, g) for each species in each year during each period (g and d). The 20 abundance values per species were averaged to calculate the mean abundance value (MAV, D) for each species in each period. The projected changes in species abundance (SRs) were calculated by averaging the ΔMAV (D, equation 2) for each species among all the sampling sites (D, equation 3). All the analyses were repeated for each climate model (e,f) (Table ST2).

