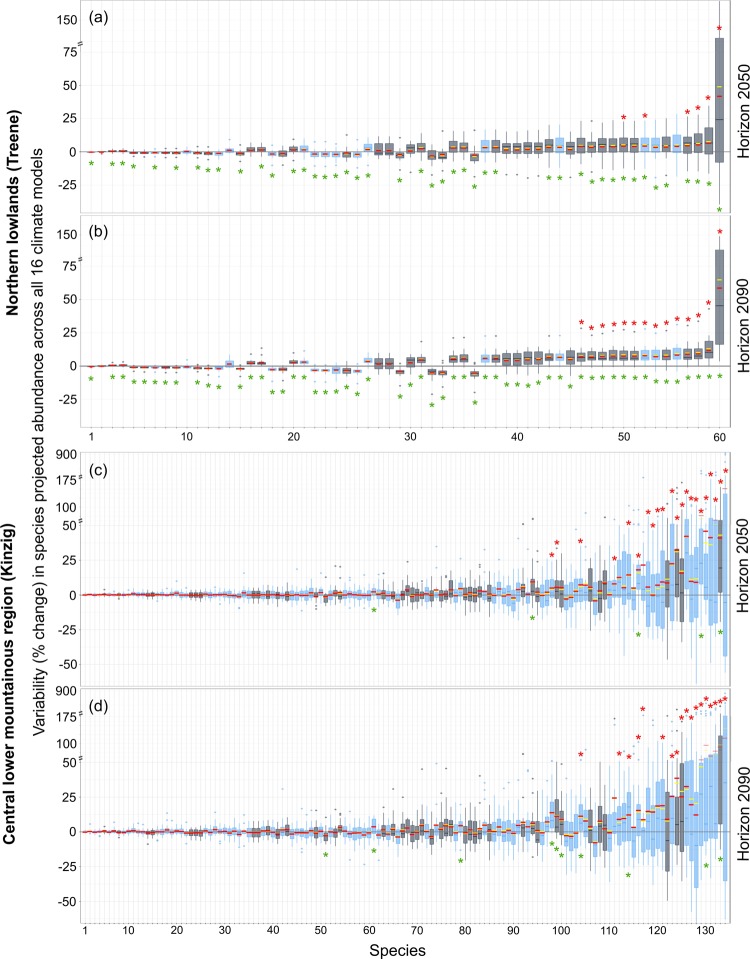
Figure 4.
The variability in the projected abundance of individual species (SRs) in the central lower mountainous region (a,b) and the northern lowlands (c,d) across all 16 GCMs and RCMs (i.e., 16 values per species box plot) in horizon 2050 (a,c) and horizon 2090 (b,d). A significantly (t-test, p < 0.05) large overall weighted mean of the relative change in the abundance of each species compared to the average value across all species and all climate models is indicated by red asterisks ( ) above the boxplots. A significantly (t-test, p < 0.01) different overall mean value from zero is indicated by green asterisks (
 ) below the boxplots. Gray boxplots represent species that occur in both catchments (for detailed information on species names and coefficients of variation belonging to each boxplot, see Figs. SF1 and SF2 and Tables ST4 and ST5).

