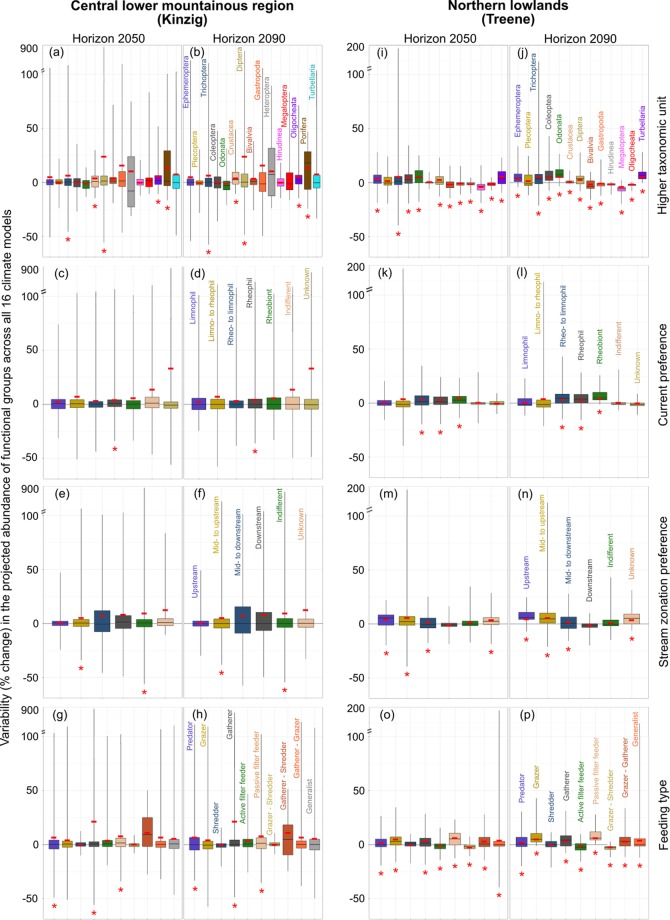
Figure 5.
Variability in the projected abundance of the higher taxonomic units (a,b,i, and j) and functional groups (all others) in the central lower mountainous region (left column) and the northern lowlands (right column) to flow alterations across all 16 GCMs and RCMs and all sampling sites for horizon 2050 and horizon 2090. The red asterisks ( ) indicate whether the overall weighted mean value (red hyphen in the middle of the boxplots) of the relative change in abundance among all the species in each functional group across all 16 GCMs and RCMs is significantly different from zero.

