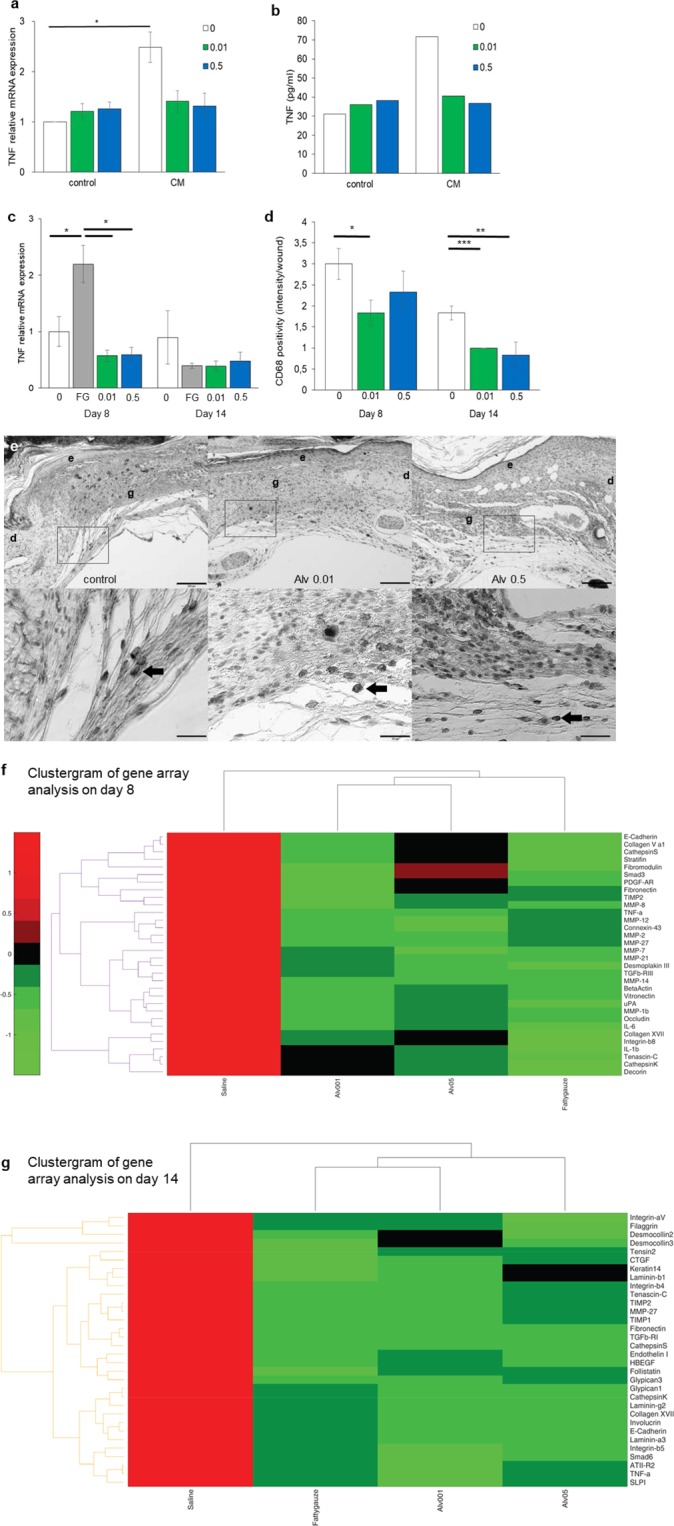
Figure 3.

Alveofact attenuates wound inflammation. (a,b) TNF mRNA (a) and protein (b) expression in PBMCs and media. (a) TNF mRNA was significantly (*p<0.05) increased in conditioned media (CM) compared to fresh media (control) quantified by qRT-PCR. This effect was not seen with Alv. n = 3. (*p<0.05). (b) TNF protein was increased in conditioned PBMC media without treatment compared to fresh media. No increase was noted with Alv. n = 1. (c) TNF mRNA expression in wounds was determined by qRT-PCR. Significantly more TNF expression was found with fatty gauze compared to control or both Alv concentrations on d8. *p<0.05, **p<0.01. n = 5–6. Mean ± SEM (Student’s t-test). (d,e) Macrophage infiltration was assessed in full-thickness excisional wound tissue by CD68 immunohistochemistry (n = 12 per group). (d) Significantly less macrophage infiltration was found with Alv 0.01 (d8 + d14) and Alv 0.5 (d14) compared to control. CD68 intensity was assessed by positive cell count per mm2 area. White bars 0 control; grey bars fatty gauze; green bars Alv 0.01; blue bars Alv 0.5 (Student’s t-test; *p = 0.05, **p = 0.007, ***p = 0.0003, n = 12 per group). (e) Tissue sections from control, Alv 0.01 or Alv 0.5 of d8 (CD68 dark staining, indicated by arrows). Upper lane scale bar 200 µm, close-ups in lower lane scale bar 50 µm. e epidermis, d dermis, g granulation tissue. (f,g) Clustergrams of gene array showing up- and downregulation of the pro-inflammatory genes TNF, IL-1β and IL-6 in comparison to control and the clinical standard fatty gauze (FG). (f) Gene regulation on day 8. (g) Gene regulation on day 14. Data are presented with a standard red-green-map in which red represents values above the mean, black represents the mean, and green represents values below the mean of a row (gene) across all columns (samples). 0 control, FG fatty gauze, Alv at 0.01 and 0.5 mg/mL.
