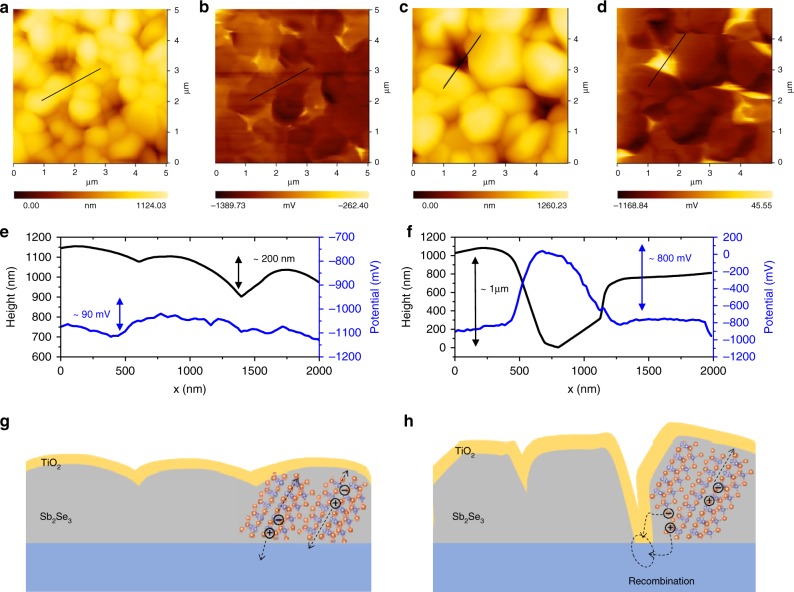
Fig. 3. Topography and surface potential of TiO2/Sb2Se3 according to KPFM analysis.
a, c Topography of a fast- and c slow-cooling samples. b, d Surface potential of b fast- and d slow-cooling samples. e, f Topography and potential line profile (obtained from scanning the black lines in Fig. 3a–d) for e fast- and f slow-cooling samples. g, h Schematics showing possible charge separation and recombination in g fast- and h slow-cooling samples. Source data used to generate this figure can be found in the Source Data file.

