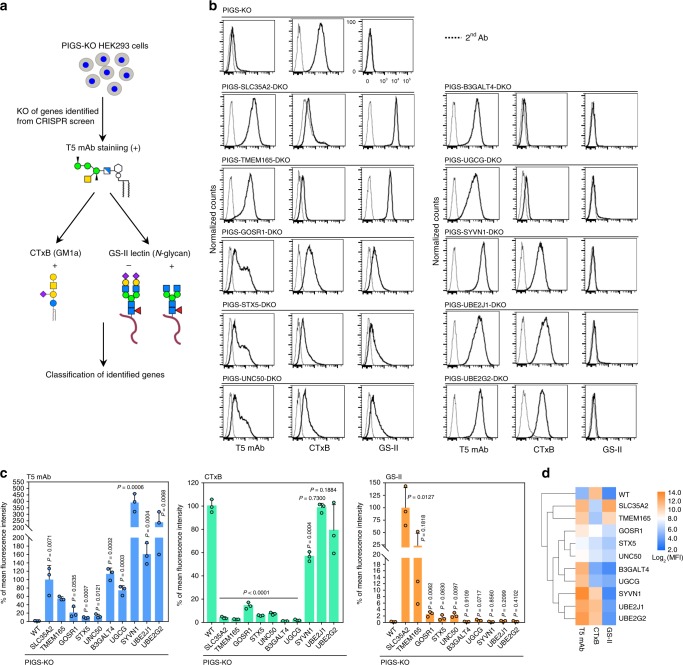
Fig. 2. Validation and phenotypic grouping of CRISPR screen hits.
a Schematic depicting validation of the CRISPR screen by further KO of individual genes and stained by T5 mAb, Cholera enterotoxin subunit B (CTxB), and GS-II lectin. b Flow cytometry analysis of PIGS-KO HEK293 cells defective in each gene among 10 top-ranking protein-coding genes identified by our CRISPR screen. Cells were stained with T5 mAb, GS-II lectin and CTxB, respectively. See also Supplementary Fig. 1g–k and Supplementary Data 2 and 3. c Quantitative data of mean fluorescence intensity (MFI) from three independent experiments (mean ± SD, n = 3) based on stainings of T5 mAb (left), CTxB (middle), and GS-II (right). P values are from t test (unpaired and two-tailed) with comparisons to control (PIGS-KO). d Hierarchical clustering of glycan profiles analyzed by flow cytometry analyses, showing the effect (log2 normalized MFI values) by each gene knockout based on staining of three probes. Source data are provided as a Source Data file.

