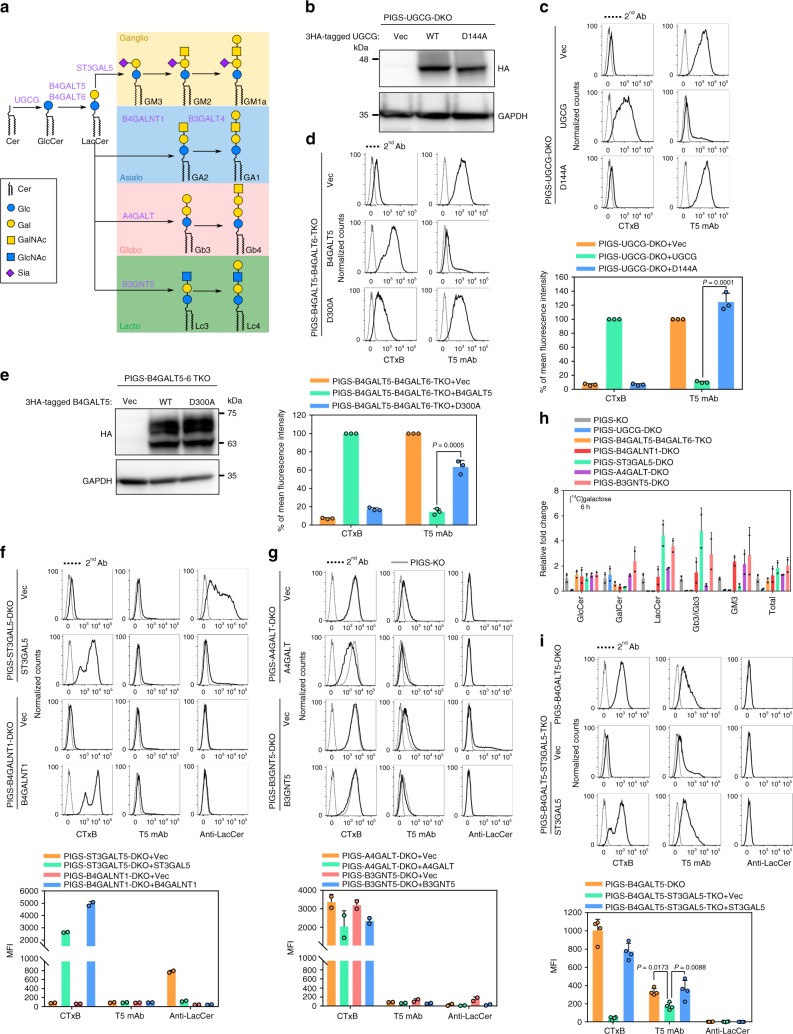
Fig. 4. Biosynthesis of LacCer is required for Gal modification of GPI-GalNAc.
a Schematic of GSL pathway. Biosynthesis of Ganglio and Asiaio are shown. b Western blotting of 3HA tagged UGCG. Lysates of PIGS-UGCG-DKO cells stably expressing pLIB2-BSD-3HA (Vec), -UGCG-3HA (UGCG), and UGCG-D144A-3HA (D144A) were analyzed. GAPDH, a loading control. c Top: PIGS-UGCG-DKO cells stably expressing Vec, UGCG or D144A were stained with CTxB and T5 mAb. Bottom: Quantitative data of MFI from three independent experiments (mean ± SD, n = 3). P values are from t test (unpaired and two-tailed) with comparisons to UGCG control. d Top: PIGS-B4GALT5-B4GALT6-TKO cells stably expressing Vec, B4GALT5 or D300A were stained with CTxB and T5 mAb. Bottom: Quantitative data of MFI from three independent experiments (mean ± SD, n = 3). P values are from t test (unpaired and two-tailed) with comparisons to B4GALT5 control. e Western blotting of 3HA tagged B4GALT5. Lysates of PIGS-B4GALT5-B4GALT6-TKO cells stably expressing pLIB2-BSD-3HA (Vec), -B4GALT5-3HA (B4GALT5), and -B4GALT5-D300A-3HA (D300A) were analyzed. f Top: PIGS-ST3GAL5-DKO cells transiently expressing Vec or mouse ST3GAL5 and PIGS-B4GALNT1-DKO cells transiently expressing Vec or human B4GALNT1 were stained with CTxB, T5 mAb, and anti-LacCer mAb. Bottom: Quantitative data of MFI from two independent experiments (mean ± SD, n = 2). g Top: PIGS-A4GALT-DKO cells stably expressing Vec or human A4GALT and PIGS-B3GNT5-DKO cells stably expressing Vec or human B3GNT5 were stained with CTxB, T5 mAb, and anti-LacCer mAb. Bottom: Quantitative data of MFI from two independent experiments (mean ± SD, n = 2). See also Supplementary Fig. 5c and d. h Quantitative data of high-performance thin-layer chromatography profile of [14C] galactose-labeled GSLs from HEK293 cells. Data from two independent experiments (mean ± SD, n = 2). See also Supplementary Fig. 5e. i Top: PIGS-B4GALT5-ST3GAL5-TKO cells transiently expressing Vec or mouse ST3GAL5 and PIGS-B4GALT5-DKO cells were stained with CTxB, T5 mAb, and anti-LacCer mAb. Bottom: Quantitative data of MFI from four independent experiments (mean ± SD, n = 4). P values are from one-way ANOVA followed by Dunnett’s test for multiple comparisons to Vec. Source data for (c, d), (f–h), and (i) are provided as a Source Data file.

