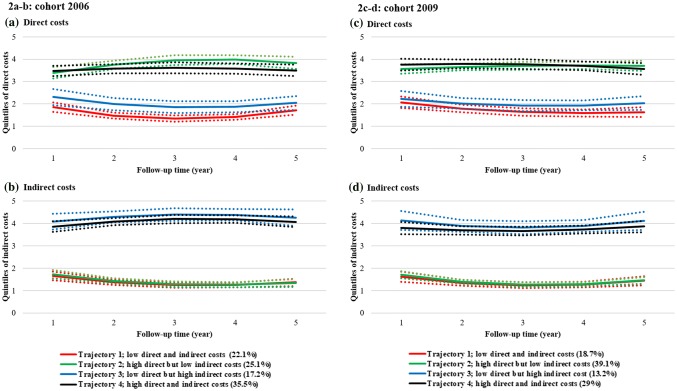
Fig. 2.
Estimated direct and indirect cost trajectories for the 2006 (a direct costs, b indirect costs) and 2009 (c direct costs, d indirect costs) study cohorts, separately, during the 5-year follow-up. Dotted lines present the 95% confidence intervals. Note 1: The values 0–1 on the y-axis denote the 1st quintile (0–20% of observations), 1–2 the 2nd (20–40% of observations), 2–3 the 3rd (40–60% of observations), 3–4 the 4th (60–80% of observations), and 4–5 the 5th (80–100% of observations). Each included individual with MS is classified for each year of follow-up into the respective quintile for direct and indirect costs, i.e. individuals can be classified in different quintiles for each year of follow-up. For example, an individual diagnosed with MS in 2006 may be in the 2nd quintile (between 20% and 40% of observations) in 2006 when it comes to direct costs, but in the 3rd quintile regarding indirect costs. Note 2: Trajectories represent clusters (sub-groups) of people with MS that have a similar likelihood for belonging to the identified quintiles of costs, over time (up to 5 years after diagnosis). MS multiple sclerosis

