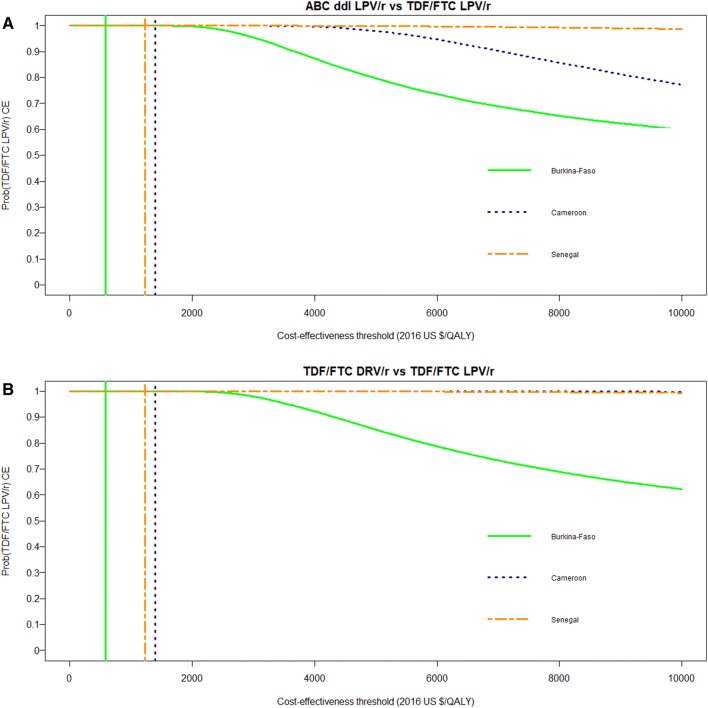
Fig. 1.
Cost-effectiveness acceptability curves of TDF/FTC LPV/r compared with ABC ddI LPV/r (a) and compared with TDF/FTC DRV/r (b) in the ANRS 12169 2LADY trial. The coloured vertical lines indicate the cost-effectiveness thresholds of 1 times the GDP/capita in 2016 for each of the three study countries (i.e. US$584 in Burkina Faso, US$1392 in Cameroon and US$1231 in Senegal). The cost-effectiveness acceptability curves show the probability that TDF/FTC LPV/r is cost-effective compared with ABC ddI LPV/r (a) and with TDF/FTC DRV/r (b) in each of the three study countries over a range of values for the cost-effectiveness threshold λ (i.e. the maximum amount that the decision maker is willing to pay for one unit of health). ABC ddI LPV/r abacavir + didanosine + lopinavir/ritonavir, Prob(TDF/FTC LPV/r CE) probability of TDF/FTC LPV/r being cost-effective at one times the country’s per-capita gross domestic product, QALYs quality-adjusted life-years, TDF/FTC DRV/r tenofovir/emtricitabine + darunavir/ritonavir, TDF/FTC LPV/r tenofovir/emtricitabine + lopinavir/ritonavir

